Cumulative count distinct for a period of 3 months
-
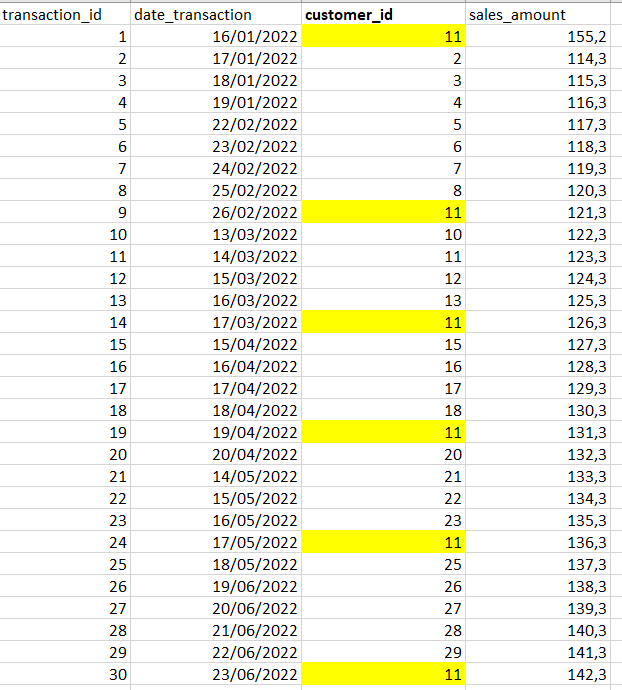
Hello Experts, I have this sample dataset that describes a transaction fact table called transaction:

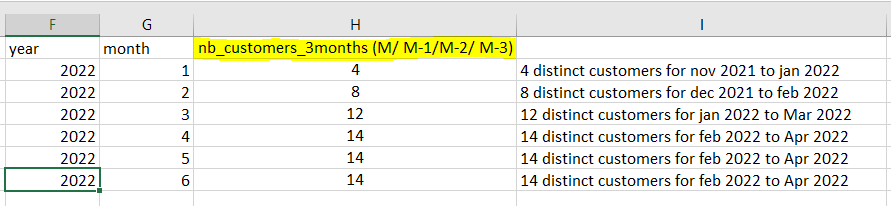
I need to write a query that gives this result:
The main goal is to calculate the customers number distinct of 3 last months for each year, month.
-
This is not an elegant way of doing it, but I think it works. I deleted my first attempt because I was too lazy to convert the values in the file to American dates. I added a DATE column called TransactionDate. There is probably a clever way of doing it without having to resort to the subquery. The datefromparts might need to be reordered for a European date format.
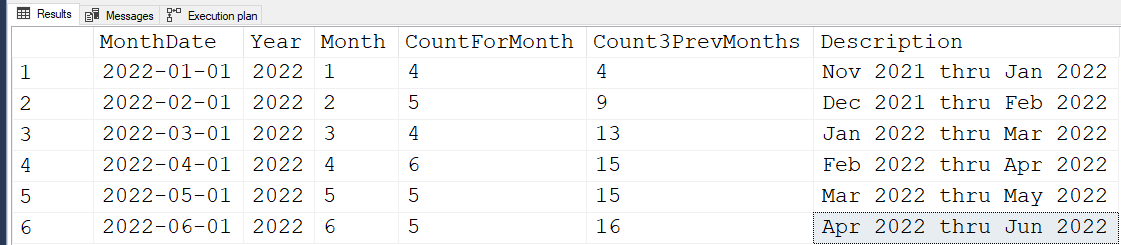
The results are slightly lower than suggested, but I think they are correct. Jan-Mar has 11 customers (2,3,4,5,6,7,8,10,11,12,13)
SELECT a.Reportyear, a.ReportMonth,
       (SELECT COUNT (DISTINCT customer_id) FROM sampleData WHERE DATEDIFF(MONTH,TransactionDate, a.FirstofMonth) BETWEEN 0 AND 2)
FROM (
       SELECT DISTINCT DATEPART(YEAR,TransactionDate) AS Reportyear,
              DATEPART(MONTH,TransactionDate) AS ReportMonth,
              DATEFROMPARTS(DATEPART(YEAR,TransactionDate), DATEPART(MONTH,TransactionDate), '01') AS FirstofMonth
       FROM sampleData
      ) AS a
ORDER BY a.ReportYear, a.ReportMonth; -
If you provide your sample data in a more accessible form, like this, you will probably get more responses:
DROP TABLE IF EXISTS #Transaction;

CREATE TABLE #Transaction(Transaction_Id INT, Date_Transaction DATE, Customer_Id INT, ...)
INSERT #Transaction
(
    Transaction_Id
   ,Date_Transaction
   ,Customer_Id
   ,
)
VALUES
(   1
   ,'20220116'
   ,11
,), (,,,) -
I imported the csv, so here's the data with a US formatted date added. I'm interested to see an elegant solution.
DROP TABLE IF EXISTS dbo.SampleData
CREATE TABLE dbo.SampleData
( transaction_id int,
  date_transaction char(10),
  transactiondate date,
  customer_id int,
  sales_amount  varchar(10)
)

INSERT dbo.SampleData
SELECT transaction_id, date_transaction_eu, CONVERT(DATE,date_transaction_us), customer_id, sales_amount
FROM  (VALUES
('1', '16/01/2022', '2022-01-16', '11', '155,2'),
('2', '17/01/2022', '2022-01-17', '2', '114,3'),
('3', '18/01/2022', '2022-01-18', '3', '115,3'),
('4', '19/01/2022', '2022-01-19', '4', '116,3'),
('5', '22/02/2022', '2022-02-22', '5', '117,3'),
('6', '23/02/2022', '2022-02-23', '6', '118,3'),
('7', '24/02/2022', '2022-02-24', '7', '119,3'),
('8', '25/02/2022', '2022-02-25', '8', '120,3'),
('9', '26/02/2022', '2022-02-26', '11', '121,3'),
('10', '13/03/2022', '2022-03-13', '10', '122,3'),
('11', '14/03/2022', '2022-03-14', '11', '123,3'),
('12', '15/03/2022', '2022-03-15', '12', '124,3'),
('13', '16/03/2022', '2022-03-16', '13', '125,3'),
('14', '17/03/2022', '2022-03-17', '11', '126,3'),
('15', '15/04/2022', '2022-04-15', '15', '127,3'),
('16', '16/04/2022', '2022-04-16', '16', '128,3'),
('17', '17/04/2022', '2022-04-17', '17', '129,3'),
('18', '18/04/2022', '2022-04-18', '18', '130,3'),
('19', '19/04/2022', '2022-04-19', '11', '131,3'),
('20', '20/04/2022', '2022-04-20', '20', '132,3'),
('21', '14/05/2022', '2022-05-14', '21', '133,3'),
('22', '15/05/2022', '2022-05-15', '22', '134,3'),
('23', '16/05/2022', '2022-05-16', '23', '135,3'),
('24', '17/05/2022', '2022-05-17', '11', '136,3'),
('25', '18/05/2022', '2022-05-18', '25', '137,3'),
('26', '19/06/2022', '2022-06-19', '26', '138,3'),
('27', '20/06/2022', '2022-06-20', '27', '139,3'),
('28', '21/06/2022', '2022-06-21', '28', '140,3'),
('29', '22/06/2022', '2022-06-22', '29', '141,3'),
('30', '23/06/2022', '2022-06-23', '11', '142,3')
) AS x (transaction_id, date_transaction_eu, date_transaction_us, customer_id, sales_amount)

SELECT  DATEPART(YEAR,TransactionDate) AS Reportyear,
        DATEPART(MONTH,TransactionDate) AS ReportMonth,
        COUNT (DISTINCT b.customer_id)
FROM    dbo.sampleData AS a
CROSS APPLY
   (
        SELECT customer_id
        FROM dbo.sampleData
        WHERE DATEDIFF(MONTH,TransactionDate, a.TransactionDate) BETWEEN 0 AND 2
   ) AS b
GROUP BY DATEPART(YEAR,a.TransactionDate),
         DATEPART(MONTH,a.TransactionDate)
ORDER BY ReportYear, ReportMonth; -
The top query has 4x fewer logical reads. The issue afaik with with combining GROUP BY and CROSS APPLY in a single SELECT statement is the logical reads are based on the cardinality of the (result set of the) FROM clause prior to summarization
set statistics io on;
with unq_dt_cte as (
    select distinct eomonth(transactiondate) t_dt
    from dbo.sampledata)
select datepart(year, t_dt) as Reportyear,
       datepart(month, t_dt) as ReportMonth,
       c.c_count
from unq_dt_cte dt
     cross apply (select count(distinct s.customer_id)
                  from dbo.SampleData s
                  where s.transactiondate > eomonth(dt.t_dt, -3)
                        and s.transactiondate < dateadd(day, 1, dt.t_dt)) c(c_count)
order by t_dt;
set statistics io off;
go

set statistics io on;
SELECT  DATEPART(YEAR,TransactionDate) AS Reportyear,
        DATEPART(MONTH,TransactionDate) AS ReportMonth,
        COUNT (DISTINCT b.customer_id)
FROM    dbo.sampleData AS a
CROSS APPLY
   (
        SELECT customer_id
        FROM dbo.sampleData
        WHERE DATEDIFF(MONTH,TransactionDate, a.TransactionDate) BETWEEN 0 AND 2
   ) AS b
GROUP BY DATEPART(YEAR,a.TransactionDate),
         DATEPART(MONTH,a.TransactionDate)
ORDER BY ReportYear, ReportMonth;
set statistics io off;Aus dem Paradies, das Cantor uns geschaffen, soll uns niemand vertreiben können
-
Never mind, you changed it.
How does this work with months of different lengths?
where s.transactiondate > dateadd(month, -3, dt.t_dt)
If dt.t_dt is '2022-02-28' then dateadd(month, -3, dt.t_dt) is '2021-11-28' which includes two dates in November
Do you need ?
where s.transactiondate > eomonth(dateadd(month, -3, dt.t_dt))
My first attempt with the subquery turns out to have the same number of reads. I still prefer your cross apply. When I use a subquery like that it's because I can't think it a way to do it "properly".
-
Nice catch yes I changed/fixed from:
where s.transactiondate > dateadd(month, -3, dt.t_dt)
to:
where s.transactiondate > eomonth(dt.t_dt, -3)
Using EOMONTH could still be considered risky if the TransactionDate column type ever changed from DATE to DATETIME. That's a standard disclaimer because the function only returns DATE even when passed a DATETIME parameter
Aus dem Paradies, das Cantor uns geschaffen, soll uns niemand vertreiben können
-
Post removed: Ed B. is correct. I made the mistake of counting distinct counts per month and then adding those counts... I needed to treat each 3 month unit as a single unit for determination of DISTINCT.
I've removed this post so no one makes the mistake of using the code I posted. Sorry, folks.
--Jeff Moden
RBAR is pronounced "ree-bar" and is a "Modenism" for Row-By-Agonizing-Row.
First step towards the paradigm shift of writing Set Based code:
________Stop thinking about what you want to do to a ROW... think, instead, of what you want to do to a COLUMN.Change is inevitable... Change for the better is not.
Helpful Links:
How to post code problems
How to Post Performance Problems
Create a Tally Function (fnTally) - Jeff Moden wrote:
Here's the output from that.
I'm confused, my understanding is that the required result is the number of distinct customers in a rolling three month period to date. The number of distinct customers in Jan, Feb, March 2022 is 11, not 13. (2, 3, 4, 5, 6, 7, 8, 10, 11, 12, 13).
If the requirement is the rolling sum of the unique customer month combinations, then the solution is far simpler. The difficulty is that the suggested output in the original post matches neither logic.
-
Not sure how you figure the total for Jan, Feb, Mar 2022 is 11. There are 4 in Jan, 5 in Feb, and 4 in Mar. 4+5=9 + 4 = 13. You can confirm that by looking at the raw data itself.EDIT: Ah... my mistake... I see what you're talking about. It's NOT how many are distinct per month added together. It's how many distinct CustomerID's there are for the entire 3 month period. Lordy, I missed that and thanks for the catch.
--Jeff Moden
RBAR is pronounced "ree-bar" and is a "Modenism" for Row-By-Agonizing-Row.
First step towards the paradigm shift of writing Set Based code:
________Stop thinking about what you want to do to a ROW... think, instead, of what you want to do to a COLUMN.Change is inevitable... Change for the better is not.
Helpful Links:
How to post code problems
How to Post Performance Problems
Create a Tally Function (fnTally) - Jeff Moden wrote:
Not sure how you figure the total for Jan, Feb, Mar 2022 is 11. There are 4 in Jan, 5 in Feb, and 4 in Mar. 4+5=9 + 4 = 13. You can confirm that by looking at the raw data itself.
We have interpreted the requirements differently, 11 is not a total is it a unique count.
- Unique customers from Jan to Mar = 11
- Sum of unique customers per month for Jan, Feb and March = 13
Customer_id 11 has transactions in Jan, Feb and March. I am calling that one unique customer rather than counting them as one customer per month for each month. Until the OP responds we won't know which they wanted, because the proposed output doesn't match either. The sum of unique customers per month lends itself to using the windowed function, how would you count the unique customers in the three month period?
-
You mentioned a Fact table... you usually only have that kind of thing in a data warehouse. Where are you analyzing said data? Because the way you would answer this question in T-SQL is different than how you would answer is if you were using DAX.
So, are you using this information to create a dashboard?
-
If you want to play with something more substantial, here's a 10 million row table to play with, complete with expected indexes. Don't let the 10 million rows scare anyone. It only takes a little over 11 seconds to run including displaying the first and last 1,000 rows in the table. Note that the code uses an fnTally() function as a row source. That function is available at a similarly name link in my signature line at the bottom of this post.
--===== If the table exists, drop it to make reruns in SSMS easier.
   DROP TABLE IF EXISTS #SampleData;
GO
--===== Create the table with what most people use for a Clustered PK.
     -- Probably not the right CI for this table, though.
 CREATE TABLE #SampleData
        (
         transaction_id     BIGINT       IDENTITY(1,1) PRIMARY KEY CLUSTERED
        ,date_transaction   DATE         NOT NULL
        ,customer_id        INT          NOT NULL
        ,sales_amount       DECIMAL(9,2) NOT NULL
        )
;
--===== Populate the table with 10 million rows of randomized data for 100,000 different customer_id's
     -- across 48 months of time.
     -- This takes advantage of "Minimal Logging" if you're NOT in the FULL Recovery Model
     -- and takes a little over 9 seconds on my box.
 INSERT INTO #SampleData WITH (TABLOCK)
        (date_transaction,customer_id,sales_amount)
 SELECT  date_transaction = DATEADD(dd,ABS(CHECKSUM(NEWID())%DATEDIFF(dd,'01 JAN 2019','01 JAN 2023')),'01 JAN 2019')
        ,customer_id      = ABS(CHECKSUM(NEWID())%100000)+1
        ,sales_amount     = RAND(CHECKSUM(NEWID()))*1000
   FROM JBMTestSSD.dbo.fnTally(1,10000000)
  ORDER BY date_transaction
;
--===== Create a non-clustered index to support the query we're working on.
     -- Same thing here.  "Minimal Logging" if you're NOT in the FULL Recovery Model.
     -- Takes a little over 2 seconds on my box.
 CREATE INDEX By_TDate_CustID ON #SampleData(date_transaction) INCLUDE(customer_id)
;
--===== Let's see the first 1000 rows.
 SELECT TOP 1000 * FROM #SampleData ORDER BY transaction_id
;
--===== Let's see the last  1000 rows.
 SELECT TOP 1000 * FROM #SampleData ORDER BY transaction_id DESC
;
I did do a rewrite to fix my mistake in understanding of what the Op was asking for (thanks again for the catch, Ed). I first tested it against Ed's code and it matches his for correctness in the output and then changed the table name and column names to match the test table above.
I tested Ed's code and I was right about the accidental Cartesian Product in his code. The code slows down quite a bit at 10,000 rows and gets exponentially slower with scale.
Then I went and looked at Steve's code and my code turned out to be very similar to his. My only concern there is the same concern that Steve spoke of earlier... the use of EOMonth is risky as either start or end dates because of the missing time element the function provides as a result. Mine considers time even if it's not present in this example and I always used CLOSED/OPEN temporal criteria rather than CLOSED/CLOSED or OPEN/OPEN just in case someone decides to use the code for something where time is involved. A additional DATEADD() and changing the form of the criteria to CLOSED/OPEN would fix that on Steve's good code, though.
Here's what I came up with for my rewrite. If you don't need the two extra columns, comment them out or delete them. I also added "#" signs to year and month so that they wouldn't be reserved words.
    SET STATISTICS TIME,IO ON
;
   WITH cteMonths AS
(--==== Creates a list of months and month range dates for eadh month.
 SELECT  LoMonth  = DATEADD(mm,-2,mm.CurMonth)
        ,CurMonth = mm.CurMonth
        ,CoMonth  = DATEADD(mm,1,mm.CurMonth)
   FROM #sampledata sd
  CROSS APPLY (VALUES(DATEADD(dd,1,EOMONTH(date_transaction,-1))))mm(CurMonth)
  GROUP BY DATEADD(dd,1,EOMONTH(date_transaction,-1))
)--==== The "Display Layer"
 SELECT  MonthDate    = m.CurMonth
        ,Year#        = DATEPART(yy,m.CurMonth)
        ,Month#       = DATEPART(mm,m.CurMonth)
        ,DistinctCnt  = c.Count3Mo
        ,PeriodDesc   = CONCAT(SUBSTRING(CONVERT(NVARCHAR(20),m.LoMonth,106),4,20)
                              ,' thru '
                              ,SUBSTRING(CONVERT(NVARCHAR(20),m.CurMonth,106),4,20))
   FROM cteMonths m
  CROSS APPLY (--==== This gets the count of distinct IDs for each rolling 3 month period.
               SELECT COUNT(DISTINCT customer_id)
                 FROM #sampledata sd
                WHERE sd.date_transaction >= m.LoMonth
                  AND sd.date_transaction <  m.CoMonth)c(Count3Mo)
  ORDER BY MonthDate
;
    SET STATISTICS TIME,IO OFF
;
P.S. The run time for both Steve's code and the code above is about 6 seconds for all 48 months/10 million rows.
--Jeff Moden
RBAR is pronounced "ree-bar" and is a "Modenism" for Row-By-Agonizing-Row.
First step towards the paradigm shift of writing Set Based code:
________Stop thinking about what you want to do to a ROW... think, instead, of what you want to do to a COLUMN.Change is inevitable... Change for the better is not.
Helpful Links:
How to post code problems
How to Post Performance Problems
Create a Tally Function (fnTally) -
Hello Experts , i shared my solution that works fine for my business need but i explain it to ou example SampleData :
DECLARE @StartPeriodLast2Months DATETIME = DATETIMEFROMPARTS(YEAR(DATEADD(MONTH,-15,GETDATE())),MONTH(DATEADD(MONTH,-15,GETDATE())),1, 0, 0, 0, 0)
,@EndPeriodINC_1 DATETIME = DATETIMEFROMPARTS(YEAR(DATEADD(MONTH,-13,getdate())), MONTH(DATEADD(MONTH,-13,getdate())) ,DAY(EOMONTH(DATEADD(MONTH,-13,getdate()))),23, 59, 59, 59)
,@EndPeriodINC_2 DATETIME = DATETIMEFROMPARTS(YEAR(DATEADD(MONTH,-13,getdate())), MONTH(DATEADD(MONTH,-13,getdate())) ,DAY(EOMONTH(DATEADD(MONTH,-13,getdate()))),23, 59, 59, 59)
select @StartPeriodLast2Months ,@EndPeriodINC_2
create table #KPI_last_3months (Year int, Month int,
Nbrcustomers_3months int)
SET @Counter=0
set @ind = -13
WHILE ( @Counter <= 12)
-- why <= 12 : my business need to count KPI in the last year started from Year(getdate()) -1
-- example today 2022-07-05 : last year for KPI : 2021-06-05 --> 2022- 06-05
-- and we start to calculate nbrcustomers for 2021-06 (inculdes 2021-04 , 2021-05, to 2021-06-30 : 3 months)
BEGIN
INSERT into #KPI_last_3months
SELECT year,
month,
COUNT(DISTINCT customer_id ) AS NbrCustomers_3months,
from
(
SELECT
YEAR(@EndPeriodINC_2) year
,MONTH(@EndPeriodINC_2) month
,customer_id
from sampleData)
WHERE
cast(date_transaction as date) >= @StartPeriodLast2Months
AND cast(date_transaction as date)< @EndPeriodINC_2
)
SET @Counter = @Counter + 1
set @StartPeriodLast2Months = DATEADD(month,1,@StartPeriodLast2Months)
set @ind = @ind + 1
set @EndPeriodINC_2 = DATETIMEFROMPARTS(YEAR(DATEADD(MONTH,@ind,getdate())), MONTH(DATEADD(MONTH,@ind,getdate())) ,DAY(EOMONTH(DATEADD(MONTH,@ind,getdate()))),23, 59, 59, 59)
END
select * from #KPI_last_3months
-
- Your code has errors in it
- You use a loop to hit sampleData 12 times
- You miss any data that may fall in the last second of the day
I would suggest a set-based solution similar to the following
WITH cteDateRange AS (
  SELECT  minDate                = DATEADD(MM, DATEDIFF(MM, 0, GETDATE()) -15, 0)
        , maxDate                = DATEADD(MM, DATEDIFF(MM, 0, GETDATE()), 0)
        , StartPeriodLast2Months = DATEADD(MM, DATEDIFF(MM, 0, GETDATE()) -15 + x.M, 0)
        , EndPeriodINC_2         = DATEADD(MM, DATEDIFF(MM, 0, GETDATE()) -12 + x.M, 0)
  FROM (VALUES (0), (1), (2), (3), (4), (5), (6), (7), (8), (9), (10), (11), (12)) AS x(M)
)
INSERT INTO #KPI_last_3months ( [Year], [Month], Nbrcustomers_3months )
SELECT [year]  = YEAR(mnth.EndPeriodINC_2 -1)
     , [month] = MONTH(mnth.EndPeriodINC_2 -1)
     , NbrCustomers_3months = COUNT( DISTINCT CASE WHEN CAST(src.date_transaction AS datetime) >= mnth.StartPeriodLast2Months
                                                    AND CAST(src.date_transaction AS datetime) <  mnth.EndPeriodINC_2
                                                    THEN src.customer_id ELSE NULL END )
FROM      cteDateRange AS mnth
LEFT JOIN sampleData   AS src
       ON CAST(src.date_transaction AS datetime) >= mnth.minDate
      AND CAST(src.date_transaction AS datetime) <  mnth.maxDate
GROUP BY mnth.EndPeriodINC_2
ORDER BY mnth.EndPeriodINC_2;
Viewing 15 posts - 1 through 15 (of 17 total)
You must be logged in to reply to this topic. Login to reply