2012 - 17 Performance Issue
-
Good afternoon everyone,
This may sound familiar, but we are yet to find a solution. We are in the middle of a platform upgrade from 2012 - 2017 utilising some vastly superior hardware. However we have found that performance has degraded, rather than the expected improvement on the tests so far.
For example, when we are running identical small queries (simple selects) on identical databases, one on a heavily loaded production server on 2012, and the other on the new server (2017) with no load, we are seeing it taking about 4 times as long to execute on the new one.
We have also noticed that when running a very large query, the new server on the first go is much faster, however for all subsequent re-runs, the old server is twice the speed. For example on a large query:
Old Server: 1st run 47 seconds, subsequent runs 3-6 seconds
New Server 1st run, 11 seconds, all subsequent runs, 10-11 seconds.
We tried the OPTION (RECOMPILE) switch, and the results are as above again every time. It is almost as if the new server never learns a faster route.
We can see the cached plans, and have checked that the execution plans are identical. We have so far:
- Played with compatibility settings
- Varied the Legacy Cardinality Setting
- Varied MDOP and Cost Threshold for Parrallelism
Any suggestions gratefully received.
Matthew
-
Update statistics?
-
Apologies, should have stated, have also rebuilt indexes and updated statistics.
The bit that stands out to me is the fact I can run a large query (100,000 rows), and the same execution time comes up again and again. Then if I delete the cache, it is is still the same.
Matthew
-
That suggests to me that the data isn't being retained in the cache. How does the amount of RAM and the max server memory setting compare between the two servers? Are there any jobs, reports, index maintenance or anything else running in the background on the new server?
You may find it helpful to analyse the wait stats. You'll need to capture and store them first, so that you can see what wait types feature most heavily while the queries are running.
John
-
check in the database settings if you have "legacy cardinality estimation" turned on - also if you can change the database compatability mode you may get some better results
i'd forget option (recompile) - turn on the query store in your problem database, run a dbcc freeprocache and then re-run your queries a few times - go have a look in the query store and see how your plans look for that query. - if you get one that is the best performing then click on the plan you want and select "force plan" - you can always unforce it (and it doesn't change your code)
MVDBA
-
Hi,
@john-2: The server is idling, with only one DB running. No tasks. The RAM is set min 10gb to max 70gb. The current production server is max 25gb. Task manager shows no strain whatsoever.
The wait stats do show ASYNC_NETWORK_IO for about 80% of the query time. Which doesn't make sense as we are just using SMSS.
@MVDBAS: Have tried various settings with the "legacy cardinality estimation", and moved the compatibility settings about. I had a look at the query store. But I only get one plan. It is a straightforward select, so not expecting too many options. Forcing the plan has no effect.
I am very used to SQL server being slow on first query, with a very noticeable increase in speed on repeat queries.
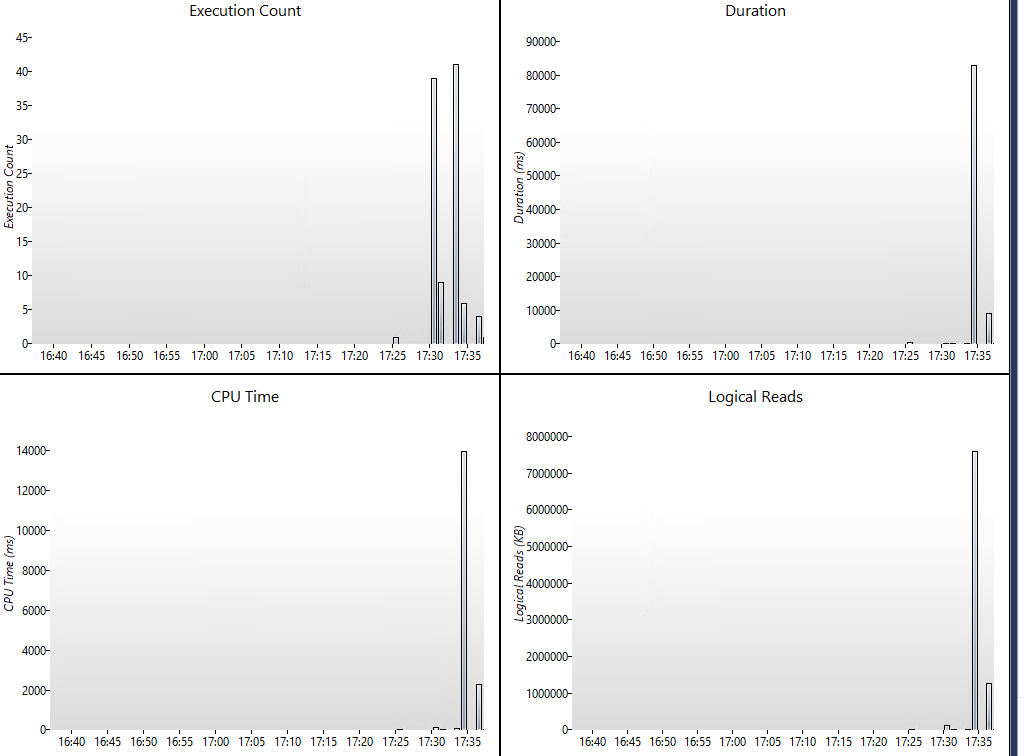
Server doesn't look stressed to me:

Any help really appreciated.
Matthew
-
Have you checked how the execution plans differ between the two servers?
-
one trick i use... Does it hang before the first row comes back, or start sending results and stall?
if you get nothing for 10 seconds I'd put money on compiles.
if you get a few rows back and it sits there waiting then its scanning values and trying to get to the end of the table
MVDBA
-
someone troubleshot similar issue and NIC teaming was the cause. It may not be the same, but it included a good reference to dig in.
https://www.sqlservercentral.com/articles/workplace-encounters-grappling-with-async_network_io-waits
https://www.sqlshack.com/reducing-sql-server-async_network_io-wait-type/
-
good shout sterling. It's got to be either network transfer or disk.
for network transfer, log onto the desktop and make sure your connection is using the shared memmory protocol (not tcp) .... Might just prove it is one or the other.
also... You could use Sql io stress and see if your disks/controllers are responding well
MVDBA
-
So you've tried setting the DB level compatibility mode back to 110? (2012)?
I gather you've come across this link already then ?
-
Try below tips and see if it works ?
Check once if in Production DB (Old Server) there exists Partition on the tables you are using in your query and similar table partition is not available in the New DB (New Server).
Also, check the Physical Structure of your database like File Group, How many data files? etc. on both the servers?
You can also check if the table is compressed in Production and is not in the New Server.
Viewing 13 posts - 1 through 13 (of 13 total)
You must be logged in to reply to this topic. Login to reply