

UPDATE: 3/16/2020
The first script below was updated from setting QDS to “Read_Write” instead of “Read_Only”. Martin thank you for pointing this out in your comment below.
This month’s T-SQL Tuesday is hosted by Tracy Boggiano. Tracy invites us all to write about adopting Query Store. Today, I wanted to share my favorite but a very unique way I use the Query Store for Workload Replays.
You can read more about the invite in detail by clicking on the T-SQL Tuesday logo in this post.
Today, I wanted to talk about my least favorite part of replaying workloads. It’s having an extended event or server-side trace running during a workload replay only so we can compare the results at a query-level when the replay is finished. Now, this might seem like a trivial thing but when you have workloads over 10k batch requests/sec this can consume terabytes of data quickly. The worst part is waiting to read all the data, slice and dice the data for analysis.
Starting with SQL Server 2016 there is a better and faster way to go! You can replace your extended event or server-side trace with Query Store captured data. Today, I will show you how to use the Query Store for the same purpose.
Different Settings
Keep in mind our goal here is very different from the typical use case for using the Query Store. We want to capture metrics for all the queries executed during a workload replay. Nothing more and nothing less.
If we have the runtime results for multiple replays we can then easily compare the workload performance between the workload replays.
Most of our changes from the regular Query Store best practices are shown below:
- Max Size (MB) – Need to make sure there is enough space to capture your whole workload. This size will vary by how much workload is being replayed.
- Query Store Capture Mode set to All. Normally, not ideal, but remember we want to capture metrics for our whole workload being replayed.
- Size Based Cleanup Mode set Off – Yup, we don’t want to lose our workload data that is capture until we persist in our ideal form. More on this later.
The Capture Process
Now, this is where you would use Database Experimentation Assistant (DEA), Distributed Replay or some other process to replay your consistent workload in an isolated non-production environment. This subject we will cover in another future post. For now, we will just have two replays called “Baseline” and “Change”. This simulates a baseline replay with no schema changes and then another change replay with a change introduced in the schema.
To capture our workload we just enable the Query store with our settings mentioned above and also clear out the query store right before our workload replay starts to help ensure we are just capturing our workload.
USE [master]
GO
ALTER DATABASE [YourDatabase] SET QUERY_STORE = ON
GO
ALTER DATABASE [YourDatabase]
SET QUERY_STORE (OPERATION_MODE = READ_WRITE,
 MAX_STORAGE_SIZE_MB = 10000,
 QUERY_CAPTURE_MODE = AUTO,
 SIZE_BASED_CLEANUP_MODE = OFF)
GO
ALTER DATABASE [YourDatabase] SET QUERY_STORE CLEAR
GO
Stop Capturing Query Store Data
Once your replay is finished we will want to disable the query store from writing data into the query store. We want the least amount of non-workload data inside of the Query Store when we are using it for the sole purpose of comparing workloads.
USE [master]
GO
ALTER DATABASE [YourDatabase]
SET QUERY_STORE (OPERATION_MODE = READ_ONLY)
GO
Prepare Query Store Data for Long-Term Analysis
Now for smaller workloads, one might be happy with utilizing DBCC CLONEDATABASE to have a schema-copy of their workload with Query Store data persisted. This is perfectly fine. With bigger workloads being captured I have noticed there are ways to improve the performance of query store when doing analysis of the query store data. For example, clustered columnstore indexes can be very helpful for performance and compacity. Therefore, I like to have a schema for each replay and import the data. The following is a quick example of setting up a schema for a “baseline” replay and a “change” replay.
CREATE DATABASE [DBA]
GO
use [DBA]
GO
CREATE SCHEMA Baseline;
GO
CREATE SCHEMA Compare;
GO
Next, we will import our captured data from our baseline replay that’s in our read-only query store database. I also like to have a baked-in aggregate of metrics for reads, writes, duration and CPU at the query level.
use [YourDatabase]
GO
/* Load Data */SELECT * INTO DBA.Baseline.query_store_runtime_stats
FROM sys.query_store_runtime_stats;

SELECT * INTO DBA.Baseline.query_store_runtime_stats_interval
from sys.query_store_runtime_stats_interval;

select * INTO DBA.Baseline.query_store_plan
from sys.query_store_plan;

select * INTO DBA.Baseline.query_store_query
from sys.query_store_query;

select * INTO DBA.Baseline.query_store_query_text
from sys.query_store_query_text;
/* Addition for SQL 2017 */select * INTO DBA.Baseline.query_store_wait_stats
 from sys.query_store_wait_stats

use [DBA]
GO

SELECT SUM(Count_executions) AS TotalExecutions,
SUM(Count_executions*avg_duration) AS TotalDuration,
SUM(Count_executions*avg_logical_io_reads) AS TotalReads,
SUM(Count_executions*avg_logical_io_writes) AS TotalWrites,
SUM(count_executions*avg_cpu_time) AS TotalCPU,
query_hash
INTO Baseline.QueryResults
FROM Baseline.query_store_runtime_stats rs
JOIN Baseline.query_store_plan p ON rs.plan_id = p.plan_id
JOIN Baseline.query_store_query q ON p.query_id = q.query_id
GROUP BY q.query_hash
Next, we would reset the database to our starting position and add our query store settings as mentioned above in this blog post and replay or workload again. This time, we would dump our data into the “change” schema
use [YourDatabase]
GO
/* Load Data */SELECT * INTO DBA.Compare.query_store_runtime_stats
FROM sys.query_store_runtime_stats;

SELECT * INTO DBA.Compare.query_store_runtime_stats_interval
from sys.query_store_runtime_stats_interval;

select * INTO DBA.Compare.query_store_plan
from sys.query_store_plan;

select * INTO DBA.Compare.query_store_query
from sys.query_store_query;

select * INTO DBA.Compare.query_store_query_text
from sys.query_store_query_text;

select * INTO DBA.Compare.query_store_wait_stats
 from sys.query_store_wait_stats

use [DBA]
GO

SELECT SUM(Count_executions) AS TotalExecutions,
SUM(Count_executions*avg_duration) AS TotalDuration,
SUM(Count_executions*avg_logical_io_reads) AS TotalReads,
SUM(Count_executions*avg_logical_io_writes) AS TotalWrites,
SUM(count_executions*avg_cpu_time) AS TotalCPU,
query_hash
INTO Compare.QueryResults
FROM Compare.query_store_runtime_stats rs
JOIN Compare.query_store_plan p ON rs.plan_id = p.plan_id
JOIN Compare.query_store_query q ON p.query_id = q.query_id
GROUP BY q.query_hash
Comparing Workload Results
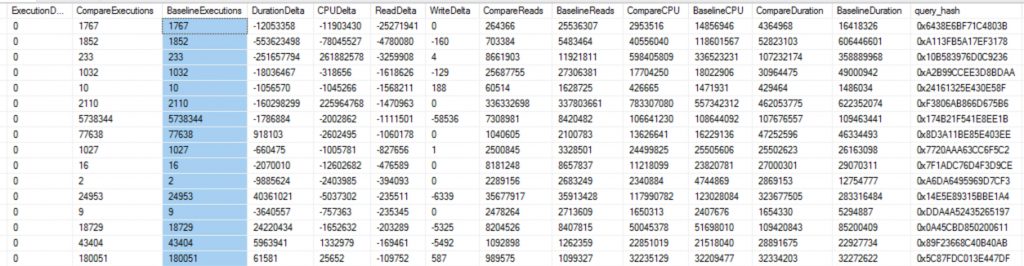
Now that we have our two workloads imported we can now compare to see how the workload changed per query. I will break this down into two quick steps. First, get deltas per query. Second, get totals for how many times a query might be different in the query store. More on this a little later in the post.
/* Query Store Results */use [DBA]
GO

SELECT DISTINCT
c.TotalExecutions - b.TotalExecutions AS ExecutionDelta,
c.TotalExecutions AS CompareExecutions,
b.TotalExecutions AS BaselineExecutions,
c.TotalDuration - b.TotalDuration AS DurationDelta,
c.TotalCPU - b.TotalCPU AS CPUDelta,
c.TotalReads - b.TotalReads AS ReadDelta,
c.TotalWrites - b.TotalWrites AS WriteDelta,
c.TotalReads AS CompareReads,
b.TotalReads AS BaselineReads,
c.TotalCPU AS CompareCPU,
b.TotalCPU AS BaselineCPU,
c.TotalDuration AS CompareDuration,
b.TotalDuration AS BaselineDuration,
c.query_hash
--q.query_sql_text
INTO #CTE
FROM Baseline.QueryResults b
JOIN Compare.QueryResults c ON b.query_hash = c.query_hash


select COUNT(query_sql_text) AS QueryCount,
MAX(query_sql_text) query_sql_text,
MIN(query_id) MinQueryID,
qsq.query_hash
INTO #Compare
from Compare.query_store_query qsq
JOIN Compare.query_store_query_text q
ON qsq.query_text_id = q.query_text_id
where qsq.is_internal_query = 0
GROUP BY query_hash

select COUNT(query_sql_text) AS QueryCount,
MAX(query_sql_text) query_sql_text,
MIN(query_id) MinQueryID,
qsq.query_hash
INTO #Baseline
from Baseline.query_store_query qsq
JOIN Baseline.query_store_query_text q
ON qsq.query_text_id = q.query_text_id
where qsq.is_internal_query = 0
GROUP BY query_hash

select cte.*
, a.QueryCount AS Compare_QueryCount
, b.QueryCount AS Baseline_QueryCount
, a.MinQueryID AS Compare_MinQueryID
, b.MinQueryID AS Baseline_MinQueryID
, a.query_sql_text
FROM #CTE cte
JOIN #Compare a on cte.query_hash = a.query_hash
JOIN #Baseline b on cte.query_hash = b.query_hash
WHERE 1=1
AND ExecutionDelta = 0
ORDER BY ReadDelta ASC
Query Store for Workload Replays
Lessons Learned Along the Way!
Initially, working with the query store I thought query_id was going to be my best friend. I quickly learned that my old friend query_hash is more helpful for multiple reasons. One, I can easily compare queries between different replays. That’s right now all workload replays get you the same query_id even when the workload is the exact same being replayed. Two, I can compare them with different databases as well. Finally, query_hash is very helpful with ad-hoc workloads as I can aggregate all the different query_ids that have the same query hash.
Need Performance Tuning Help?
Let us help you! Schedule a free 30-minute chat to see if we can point you the right direction. If you liked this blog post signup for our free newsletter! Also, take advantage of our free training videos!.
The post Query Store for Workload Replays appeared first on SQL Server Consulting & Remote DBA Service.
![]()