

I have long been an advocate of Operations Manager, having used MOM 2005 and now Operations Manager 2007. With both versions I have been content with the out-of-the-box functionality, and Operations Manager has plenty to be excited about. Some of the functionality is there but not enabled by default, so you have to hunt it down. One item of interest to most would be the ability to effectively monitor SQL Agent jobs.
I am not talking about simply getting an email notification when a job fails. No, I am talking about more in depth information such as job duration and last run status. Both of those items are included in the SQL Management Packs (both 2000 and 2005).
In the custom Database State view I created in a previous article, I had columns for the SQL Agent. If I clicked on one of them, the details view would be displayed as in Figure 1. I would see the Agent in a healthy state, and four open circles under the Availability, Configuration, Performance, and Security columns. I started to wonder about why the circles are empty, and then I noticed the words ‘Not Monitored’. So, I set about trying to find out how to get those items to be monitored.
![]()
Figure 1
The first step is to configure the object discovery for SQL Agent jobs. This can be done by going to the authoring tab and clicking on the ‘Object Discoveries’ item as shown in Figure 2.
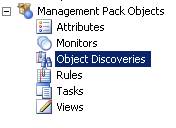
Figure 2
Your scope will need to include the SQL 2000 Agent Job and/or the SQL 2005 Agent Job targets. You should now see the following in Figure 3.
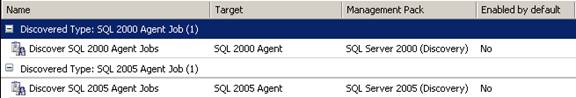
Figure 3
These discoveries are disabled by default and you will need to manually override the discoveries. In our case, we did an override for our custom group of database servers. But what does this discovery do for us? Well, it gathers info about every job within SQL Agent by using the monitors already defined. You can see the monitors by clicking on the ‘Monitors’ item on the Authoring tab, right above the Object Discoveries item as shown in Figure 2.
After selecting the Monitors item you should see Figure 4, where I have expanded the monitor for the SQL 2005 Agent Job target which is identical to the SQL 2000 Agent Job target. You will notice that there are only two monitors in total, one named Last Run Status as part of the Availability rollup and another named Job Duration as part of the Performance rollup.
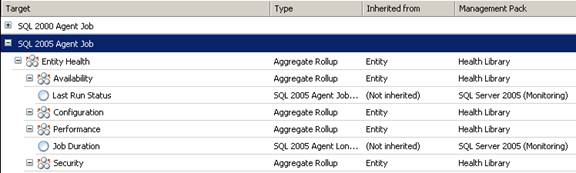
Figure 4
If you were to go back to your database state view and examine the details view for one of the SQL Agents you should see the following (Figure 5).
![]()
Figure 5
So, we have gone from four unmonitored items to only two, as Security and Configuration do not have any monitors associated with them by default. Now, after all that work, what is the end result?
If you were to double click on the line item shown in the detail view in Figure 5, you would open up the Health monitor for the SQL Server Agent (Figure 6). You can then expand the Availability and/or the Performance monitors and quickly see all of the jobs in SQL Agent for that instance. So, if a job had failed, or if a job had run too long, then you would be able to quickly see which job had the issue.
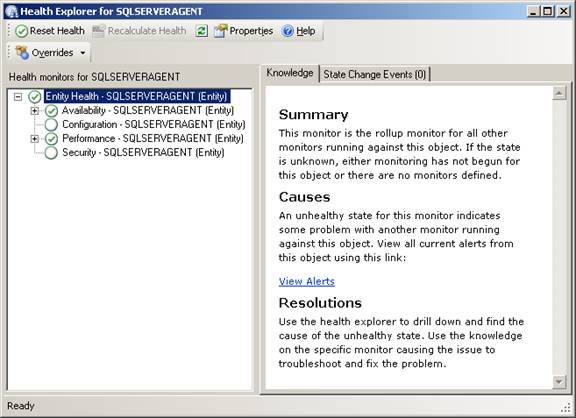
Figure 6
As good as this information may be I should point out the default settings for job duration is 60 seconds for a warning threshold and 120 seconds for an error. I am not certain about how your shop operates, but our shop uses SQL Agent jobs to do database dumps, and quite often those dumps take longer than two minutes. So, when I started enabling this functionality a while back I was alarmed to see a lot of jobs being flagged as critical. As a result, I set an override for the job duration monitor to have thresholds of 3600 and 5400 seconds as the lower and upper bounds for all jobs.
After some investigation I found that the override will not work for the SQL 2000 Agent Job Duration monitor, as that monitor does a compare to the duration taken from the msdb database, which is in the format of HHMMSS. This means that if your job runs for one hour, forty seven minutes and sixteen seconds, the msdb stores that as 14716. This number is converted to a proper format when you examine the job history through SSMS, but Operations Manager does a compare to the 14716 as if that was the duration in seconds. So, if you set an override to 7200 seconds (two hours) as an error threshold, you would be as surprised as I was that a job would be flagged as critical. But, 7200 is less than 14716, right? No, not exactly, so you will need to override your SQL 2000 Agent Jobs differently than your SQL 2005 Agent Jobs. For me, I used 10000 as the lower threshold and 13000 as the upper threshold of my SQL 2000 Agent Jobs, and eliminated a lot of false alarms.
Operations Manager has the ability to monitor additional details with regards to your SQL Agent jobs, you just need to take a few extra steps in order to start collecting some valuable information. And while it may not be perfect, it is still better overall than most in-house solutions. I find the console easy to use and by shifting our team to rely on the use of Operations Manager we are freeing up valuable time to spend on other projects.

