

Introduction
Data Compression is a feature of SQL Server 2008 and higher that can compress tables and indexes, thus reducing the size of the database and saving storage, depending on the nature of the table/index or partition being compressed.
Data Compression not only saves space, but it will also improve performance for read-intensive workloads. This is because the engine has to scan much fewer data pages depeding of the compression gains.
A possible reaction to the above is to go ahead and compress ALL tables and impress your company with the savings made on storage but there are some caveats with Data Compression:
- Only IN_ROW_DATA allocation units can be compressed
- Data Compression does have performance impact on update operations because decompressing pages for update is CPU intensive
- Performing the act itself requires careful planning for workspace (there can be significant growth of the log file)
- The degree of compression depends on factors such as number of NULL and 0 fields in the table and the degree of repetition in the data
This is a good place to mention there are two levels of Data Compression:
- ROW - optimizes data types and NULL/0 values within rows
- PAGE - minimizes data redundacy at page level. A superset of ROW compression
Scenario
In our environment we considered a certain application which keeps historical data in separate tables. The assumption was that older tables would be frequently accessed and even less frequently accessed thus would be good candidates for Data Compression. For us, the space savings was primary, performance improvement for read operations was a bonus.
The first thing we did was to determine the space used by all tables in the affected databases and focus on the top n largest tables using the query in Listing 1. You will also notice we generated the required compression statement in the same effort:
  ###################################
  # Listing 1: Largest Tables       #
  ###################################
USE DB_NAME()
GO
create table tablesize
( name varchar(100),
  rows int,
  reserved varchar(100),
  data varchar(100),
  index_size varchar(100),
  unused varchar(100)
)
GO
insert into tablesize
 exec sp_MSforeachtable 'exec sp_spaceused ''?'''
GO
select 'ALTER TABLE [dbo].[' + name + ' ] REBUILD PARTITION = ALL WITH (DATA_COMPRESSION = PAGE, SORT_IN_TEMPDB=ON, MAXDOP=8);', name [Table Name], CAST(REPLACE(data,'KB','') AS int) [Data Size (KB)], CAST(REPLACE(index_size,'KB','') AS int) [Index Size (KB)] from tablesize order by [Data Size (KB)] desc
GO
drop table tablesize
GO
The above listed can be modified by filtering for the specific tables you want to work on as in Listing 2:
#######################################
# Listing 2: Largest Tables Selected  #
#######################################
USE DB_NAME()
GO
create table tablesize (name varchar(100),rows int,reserved varchar(100),data varchar(100), index_size varchar(100),
  unused varchar(100))
GO
insert into tablesize
  exec sp_MSforeachtable 'exec sp_spaceused ''?'''
GO
select 'ALTER TABLE [dbo].[' + name + ' ] REBUILD PARTITION = ALL WITH (DATA_COMPRESSION = PAGE, SORT_IN_TEMPDB=ON, MAXDOP=8);' [Compress Statement], name [Table Name], CAST(REPLACE(data,'KB','') AS int) [Data Size (KB)], CAST(REPLACE(index_size,'KB','') AS int) [Index Size (KB)] from tablesize
where name in
  ('T1'
  ,'T2'
  ,'T3'
  ,'T4'
  ,'T5'
  )
  order by [Data Size (KB)] desc
GO
drop table tablesize
GO
The next step was to determine how much space we were actually going to save. SQL Server provides the function sp_estimate_data_compression_savings to determine the possible space gains that may result from Data Compression. In our case we used the following script to generate this information for several tables at once:
####################################
# Listing 3: Space Savings         #
####################################
USE DB_NAME
GO
create table space_savings
([object_name] varchar(50)
,[schema_name] varchar(30)
,[index_id] int
,[partition_number] int
,[size_with_current_compression_setting(KB)] int
,[size_with_requested_compression_setting(KB)] int
,[sample_size_with_current_compression_setting(KB)] int
,[sample_size_with_requested_compression_setting(KB)] int)
GO
insert into space_savings EXEC sp_estimate_data_compression_savings 'dbo','T1', NULL, NULL, 'PAGE'
insert into space_savings EXEC sp_estimate_data_compression_savings 'dbo','T2', NULL, NULL, 'PAGE'
insert into space_savings EXEC sp_estimate_data_compression_savings 'dbo','T3', NULL, NULL, 'PAGE'
insert into space_savings EXEC sp_estimate_data_compression_savings 'dbo','T4', NULL, NULL, 'PAGE'
GO
select * from space_savings
GO
drop table space_savings
GO
I mentioned earlier our assumption that older tables were infrequently updated. We tested this theory using the following variant of a scripts published by Sanjay Mishra:
####################################
# Listing 4: Percent Update #
####################################
USE DB_NAME()
GO
SELECT db_name() database_name, o.name AS [Table_Name], x.name AS [Index_Name],
       i.partition_number AS [Partition],
       i.index_id AS [Index_ID], x.type_desc AS [Index_Type],
       i.leaf_update_count * 100.0 /
           (i.range_scan_count + i.leaf_insert_count
            + i.leaf_delete_count + i.leaf_update_count
            + i.leaf_page_merge_count + i.singleton_lookup_count
           ) AS [Percent_Update]
FROM sys.dm_db_index_operational_stats (db_id(), NULL, NULL, NULL) i
JOIN sys.objects o ON o.object_id = i.object_id
JOIN sys.indexes x ON x.object_id = i.object_id AND x.index_id = i.index_id
WHERE (i.range_scan_count + i.leaf_insert_count
       + i.leaf_delete_count + leaf_update_count
       + i.leaf_page_merge_count + i.singleton_lookup_count) != 0
AND objectproperty(i.object_id,'IsUserTable') = 1
AND object_name(i.object_id) in

('T1'
,'T2'
,'T3'
,'T4'
,'T5'
)
ORDER BY [Percent_Update] ASC
###################################
# Listing 5: Percent Scan         #
###################################
USE DB_NAME()
GO
SELECT db_name() database_name, o.name AS [Table_Name], x.name AS [Index_Name],
       i.partition_number AS [Partition],
       i.index_id AS [Index_ID], x.type_desc AS [Index_Type],
       i.range_scan_count * 100.0 /
           (i.range_scan_count + i.leaf_insert_count
            + i.leaf_delete_count + i.leaf_update_count
            + i.leaf_page_merge_count + i.singleton_lookup_count
           ) AS [Percent_Scan]
FROM sys.dm_db_index_operational_stats (db_id(), NULL, NULL, NULL) i
JOIN sys.objects o ON o.object_id = i.object_id
JOIN sys.indexes x ON x.object_id = i.object_id AND x.index_id = i.index_id
WHERE (i.range_scan_count + i.leaf_insert_count
       + i.leaf_delete_count + leaf_update_count
       + i.leaf_page_merge_count + i.singleton_lookup_count) != 0
AND objectproperty(i.object_id,'IsUserTable') = 1
AND object_name(i.object_id) in
('T1'
,'T2'
,'T3'
,'T4'
,'T5'
)
ORDER BY [Percent_Scan] DESC;
Once we were confortable that we had the right set of tables we went on to apply the ALTER TABLE ... REBUILD scripts generated in Listing 2. Notice the SORT_IN_TEMPDB and MAXDOP options which are intended to improve performance. I should mention here that to get the maximum benefit from SORT_IN_TEMPDB, the tables involved must have clustered indexes otherwise the sort will only have in TempDB for non-clustered indexes if they do exist.
Result
Recall that our primary objective was space savings and we mention the possibility of impact on CPU usage especially if the tables chosen are not as idle or as devoid of updates as thought. Across two databases on which compression was applied we saved over 150GB and were able to release a significant portion of that to the operating system using DBCC SHRINKFILE. The table below is a subset of the actual recorded data though not with the real table names:
| Table Name | Orig Data Size (KB) | Orig Index Size (KB) | Curr Data Size (KB) | Curr Index Size (KB) | Space Savings Data | Space Savings Index | SSD (GB) | SSI (GB) |
| T1 | 29241216 | 280 | 14152216 | 104 | 15089000 | 176 | 14.39 | 0.00 |
| T2 | 16886960 | 3411664 | 10178040 | 6854120 | 6708920 | -3442456 | 6.40 | -3.28 |
| T3 | 10758056 | 128 | 6629120 | 88 | 4128936 | 40 | 3.94 | 0.00 |
| T4 | 5939608 | 1743936 | 5868296 | 1104816 | 71312 | 639120 | 0.07 | 0.61 |
| T5 | 5768320 | 1483472 | 5815424 | 1290048 | -47104 | 193424 | -0.04 | 0.18 |
| T6 | 5616552 | 1412600 | 5630528 | 1043632 | -13976 | 368968 | -0.01 | 0.35 |
| 24.74 | -2.14 |
Table 1: Space Savings
One thing I did find interesting in the result is the tables and indexes that actually increased in size after compression. One explanation for th tables is that the size was not immediately captured after the change was completed. For the indexes, some had not been rebuilt in a while (having not met the fragmentation threshold requirement).Other thoughts on this are welcome.
As per CPU usage, we extracted the trend of wait events from our daily checks for a period of twenty-six days and tried to identify any change in pattern of CPU usage using. There was no significant change. Since most of the tables identified for compression were hardly ever used it made sense that compressing them would not have much impact on CPU subsequently. This was already pretty obvious from the outputs of Listings 4 and 5.
| Database_Name | Table_Name | Index_Name | Partition | Index_ID | Index_Type | Percent_Scan |
| DB1 | T5 | IX_1 | 1 | 6 | NONCLUSTERED | 46.56 |
| DB1 | T4 | IX_1 | 1 | 6 | NONCLUSTERED | 12.77 |
| DB1 | T4 | IX_2 | 1 | 3 | NONCLUSTERED | 1.90 |
| DB1 | T4 | IX_3 | 1 | 10 | NONCLUSTERED | 0.37 |
| DB1 | T4 | NULL | 1 | 0 | HEAP | 0.00 |
| DB1 | T5 | NULL | 1 | 0 | HEAP | 0.00 |
| DB1 | T4 | IX_4 | 1 | 4 | NONCLUSTERED | 0.00 |
| DB1 | T4 | IX_5 | 1 | 5 | NONCLUSTERED | 0.00 |
Table 2: Percent Scan on the First Five Tables
| Database_Name | Table_Name | Index_Name | Partition | Index_ID | Index_Type | Percent_Update |
| DB1 | T4 | IX_2 | 1 | 3 | NONCLUSTERED | 0 |
| DB1 | T4 | IX_4 | 1 | 4 | NONCLUSTERED | 0 |
| DB1 | T4 | IX_5 | 1 | 5 | NONCLUSTERED | 0 |
| DB1 | T4 | IX_1 | 1 | 6 | NONCLUSTERED | 0 |
| DB1 | T4 | IX_3 | 1 | 10 | NONCLUSTERED | 0 |
| DB1 | T5 | IX_1 | 1 | 6 | NONCLUSTERED | 0 |
| DB1 | T5 | IX_2 | 1 | 10 | NONCLUSTERED | 0 |
| DB1 | T5 | NULL | 1 | 0 | HEAP | 0.008622272 |
| DB1 | T4 | NULL | 1 | 0 | HEAP | 0.079325947 |
Table 3: Percent Update on the First Five Tables
Another interesting thing you might have noticed from the data on the tables is that only two tables were captured using the scripts in Listings 4 and 5 for Percent Scan and Percent Update checks respectively. This is because the statistics are pulled from the DMF sys.dm_db_index_operational_stats which may not have any entries for a table or index if that table of index in not very active.
The graphs below show the pattern of CPU usage over the period. The compression was applied on the 21st of November and we see that except for spikes due to other operations, the pattern of key CPU related wait events is essentially the same. Actually a more accurate way to have checked this would be to create a User Defined Data Collector Set using Perfmon and specifically track counters in the Processor object.
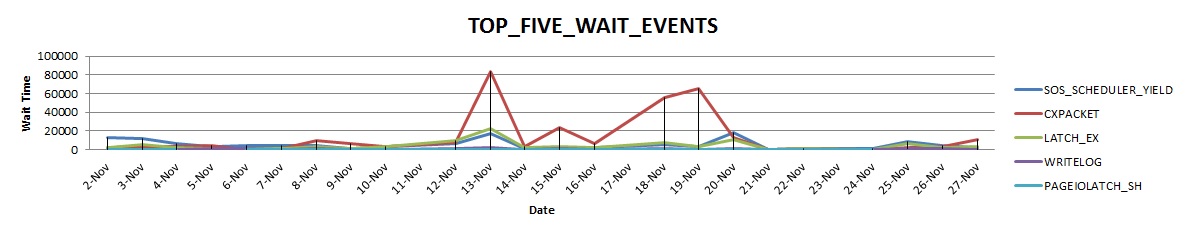
Fig 1: Top Five Wait Events
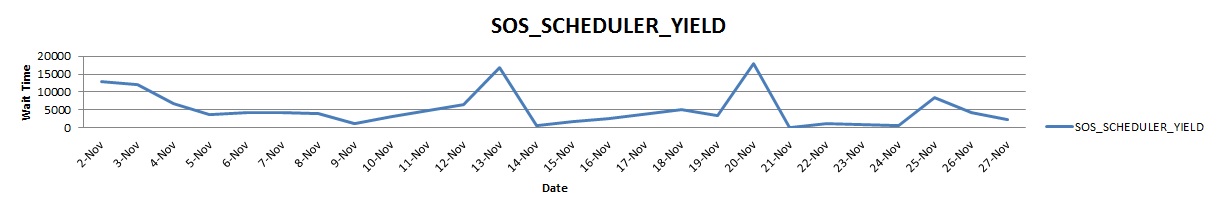
Fig 2: SOS Scheduler Wait Event
Finally we also checked for any performance improvements in terms of IO. A good way to do this is to use the SET STATISTICS IO ON statement and issue a specific SELECT statement on the tables. The SET option will return number of logical read and physical reads required. It is expected that the number of IOs will reduce after compression for a particular statement.
In our case, being pressed for time and in view of the fact that we were more concerned with space saving anyway as these tables were hardly used, we merely captured the estimated execution plan for the statements
###################################
# Listing 6: Test Statements      #
###################################
USE DB2
GO
SET STATISTICS IO ON
PRINT GETDATE()
SELECT * FROM T4;
SELECT * FROM T4;
PRINT GETDATE()
Here are outputs from tables T4 and T5:
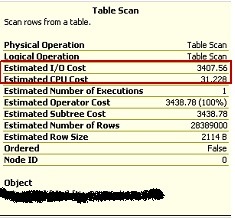
Fig 3: T4 Before Compression
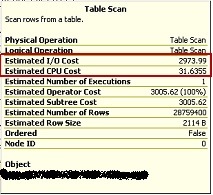
Fig 4: T4 After Compression
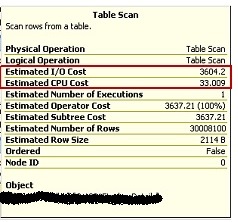
Fig 5: T5 Before Compression
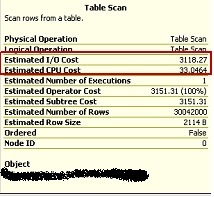
Fig 5: T5 After Compression
Notice the drop in Estimated IO Cost and the subtle rise in Estimated CPU Cost.

