

SQL Server 2008 has a new feature in SSIS: Data Profiler. For a given table, Data Profiler enables us to understand the number of distinct values in each column, and the distribution of data values. This is very useful in data warehousing, both in ETL and when building cubes in SSAS.
When building an ETL package, sometimes we need to know the data values in a column. For example, to understand whether a column is mostly empty (blank or null) or contains good data. Or to help us decide whether to exclude or include certain values or certain patterns, probably related to a data quality requirement. Or to help us identify potential hierarchies in a dimension table.
Data profile is also useful when doing performance tuning, for example when partitioning the a fact table or when partitioning a cube. Understanding the data distribution could assist us in creating similar size groups based on a particular column.
On the current SQL Server 2005 data warehousing project, I use Informatica Data Explorer (IDE) to understand the distribution of data values in the data warehouse fact and dimension tables, for the purpose of building SSAS cubes. I often asked myself: When will we be able to right click on any table in Management Studio, select 'Analyze' and get the data profile for that table?
Now in SSIS 2008 we have data profiler. Well, it's not as friendly as doing a right click on any table and select 'Analyze'. But it's a start. I hope in the later releases of SQL Server we can right click any table in Management Studio and choose 'Analyze' to get the data profile.
So let's find out what SSIS 2008 Data Profiler is all about. First, let's have a look at its output:
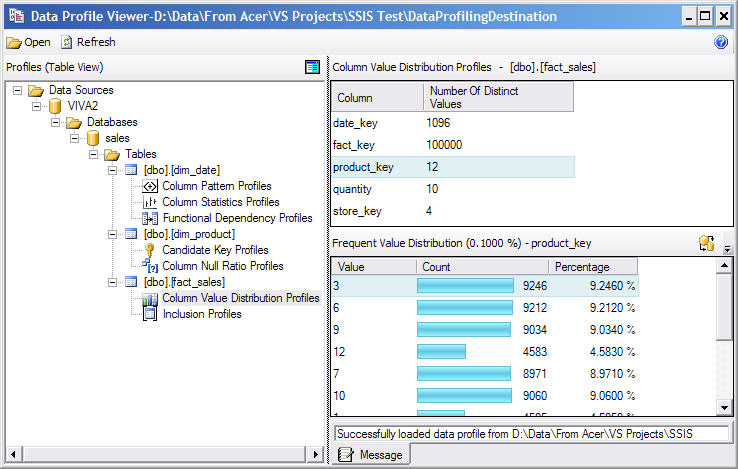
Figure 1. Output of SSIS 2008 Data Profiler
The left pane shows the tables that we analyzed, along with the profiles that we executed for each table. The right hand pane shows the details of the profile that we select on the left hand pane. For example, for 'Column Value Distribution' profile, the top right panel shows a list of columns and the number of distinct values in each column. If we click on any column on this panel, the bottom right panel displays the distribution of the data value, i.e. the value, number of rows containing that value, and the percentage of total rows. Figure 1 shows the distribution of the data values on the product_key column in the fact_sales table.
Other than analyzing the distribution of data value, SSIS 2008 Data Profiler can also analyze:
- The number of nulls in a column.
- The pattern of the data values, for example if a column contains values of 2008-01, 2008-02, …, 2008-12, then the pattern is “200d-dd” (d means digit, i.e. a number from 0 to 9).
- Minimum and maximum values of the data in each column.
- Mean (average) and standard deviation of the data values in each column. Standard deviation indicates how far the value is from the mean.
- Determine which column(s) is a good candidate for a primary key. This is useful for checking the 1st normal form rule, which states that each table must have a primary key that uniquely identifies each row.
- Checking whether a column is fully or partially dependant of other column(s). This is useful for checking the 2nd normal form and for identifying potential hierarchies within a dimension. In 2nd normal form, non primary key columns must be dependent on the primary key.
- Checking whether all values in a column exist in another table. In data warehousing, this is useful to identify if there are dimensional keys on the fact table which do not exist on the dimension table. For ODS design (or other normalized databases), this is useful to identify the 3rd normal form, which states that no column is transitively dependent on the primary key. In other words, it is useful for identifying potential foreign key relationships.
Now let's understand the 'how'.
Open BIDS, create an SSIS project, drag Data Profiling Task onto the design surface. Double click to edit it. Type the Destination File name.
Click on Profile Requests on the left pane. Select Column Value Distribution on the Profile Type column. Supply the connection details, select the Table and Column(s) at the bottom panel as shown on Figure 2 below and click OK.
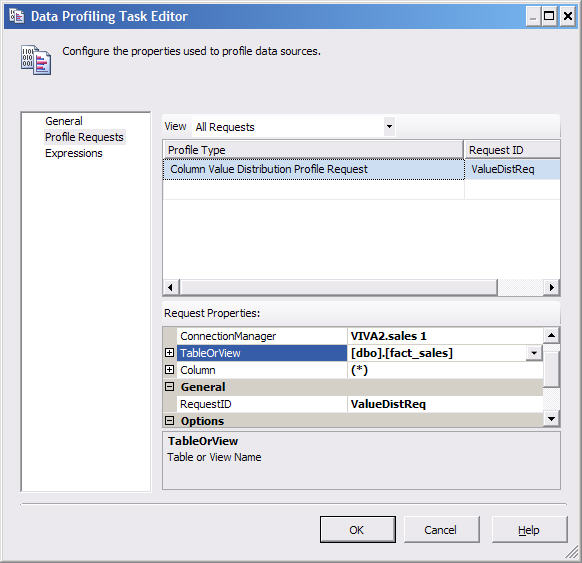
Figure 2. Setting up a Data Profiling Task in SSIS
Run the SSIS package. Verify that the output file is created.
To view the output file, we need to use Data Profile Viewer utility.
Go to C:\Program Files\Microsoft SQL Server\100\DTS\Binn (adjust to your SQL Server folder) and execute DataProfileViewer.exe. Click on Open, and open the output file that was produced by the SSIS Data Profiling Task earlier. It will look like figure 1 above.
In addition to Column Value Distribution Profiles that we chose above, we can also choose other profiles, such as Column Pattern Profiles, Column Statistics Profiles, Functional Dependency Profiles, Candidate Key Profiles, Column Null Ratio Profiles and Inclusion Profiles. These profiles provide the 7 analysis items I listed earlier.
The Data Profiling facility in SQL Server 2008 is quite basic. As is the the user friendliness. The viewer is not integrated in BI Development Studio, even in Release Candidate 0. But it is a good start. Whether it's at an additional cost or not, it is a necessity these days that an ETL tool should have a data profiling facility. I'm sure in the future SSIS data profiling feature will improve a lot. I hope that in the future releases of SQL Server, the Data Profile Viewer utility is integrated into BI Development Studio and that we can right click any table in Management Studio and choose 'Analyze' to get the data profile.
Vincent Rainardi
7th July 2008
Author of Building A Data Warehouse: With Examples in SQL Server
