

Introduction
In the previous session we discussed some of the enhancements/new-features added to SSMS 2008. This article and the previous one are based on SQL Server 2008 RC0 release. Some of the features may change in the final release of the product.
One of the features that I find very exciting is the debugging support. SSMS 2008 allows you to debug TSQL batches, stored procedures, triggers, functions etc. We will have a quick look at the debugging capabilities of SSMS in this session.
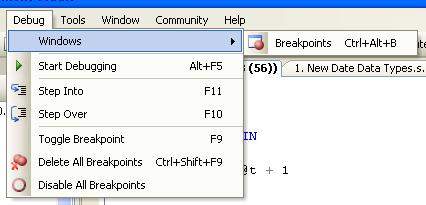
The debugging menu
The debugging menu has menu items for almost all debugging activities. You could find there almost everything that you would expect from an IDE that supports debugging.
Debugging a Batch
You could debug database objects (Stored Procedures, Functions etc) as well as TSQL batches. If you wish to debug a specific portion of the code, you could select those lines and debug it.
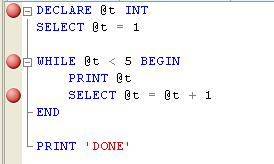
You can add/remove breakpoints by pressing F9, selecting 'Toggle Breakpoint' menu item from the 'Debug' menu. You could also do this by clicking/right-clicking on the left margin of the IDE.
Debugging information
After you start debugging, you can open several debug windows to monitor different debugging information.
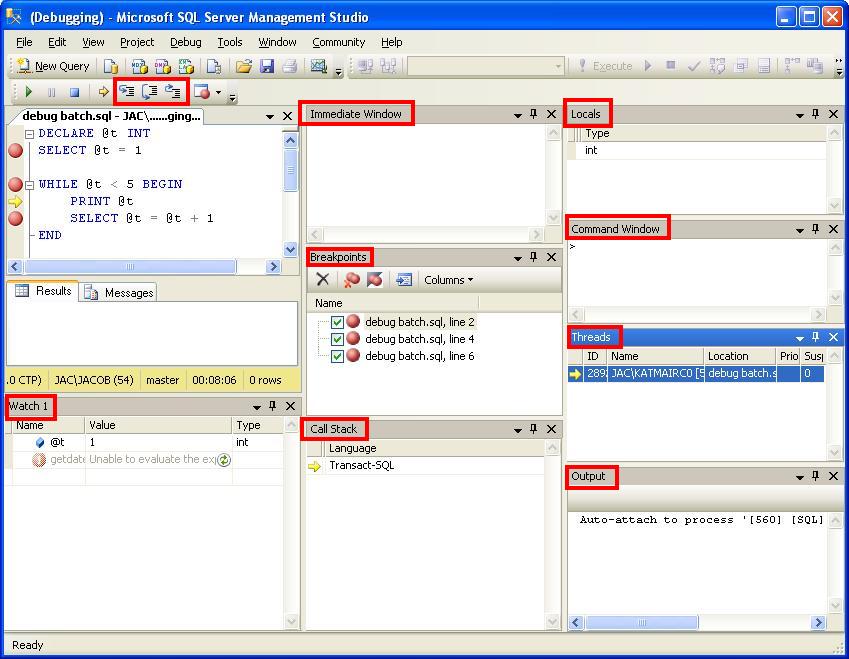
If you don't see those windows when you start debugging, you can open them from the "windows" submenu of the "debug" menu.
Using the debug windows
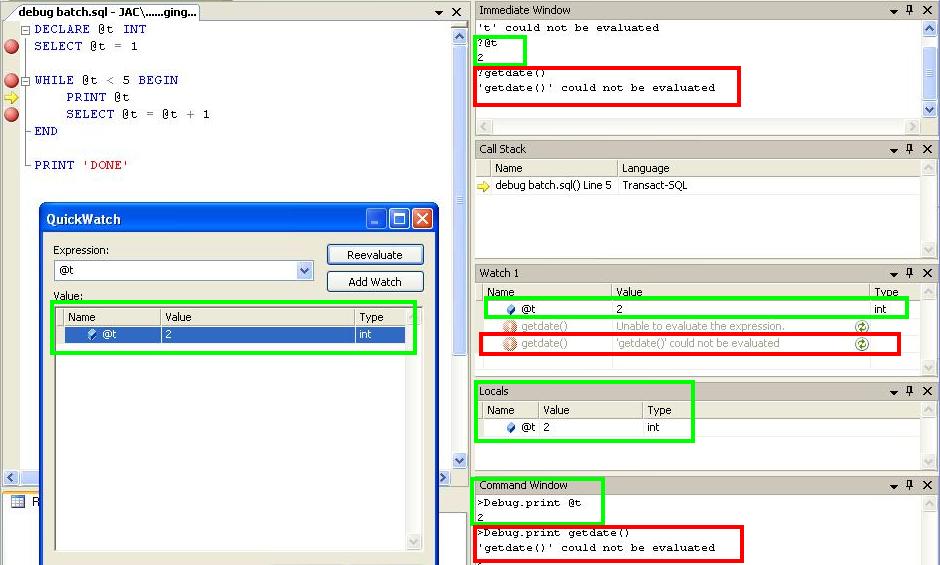
There are three windows that help to evaluate the value of expressions/variables: "immediate", "command" and "watch"/"QuickWatch". However, they do not seem to be able to evaluate functions. For example, the function "GETDATE()" returns an error.
Debugging stored procedures
Debugging stored procedures is pretty easy with SSMS. Just select the EXECUTE statement and click "Start Debugging" menu or press "ALT+F5".
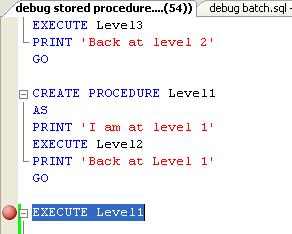
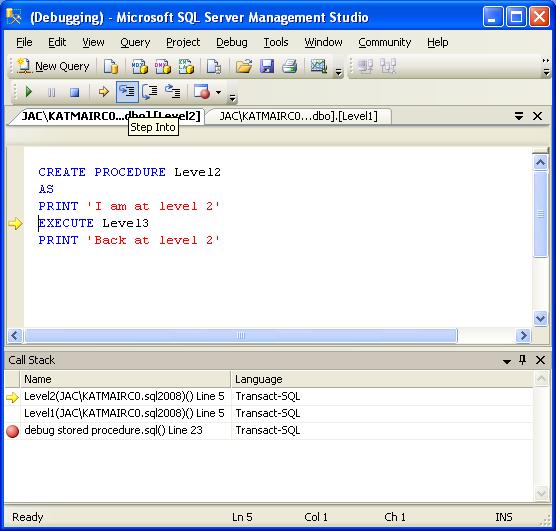
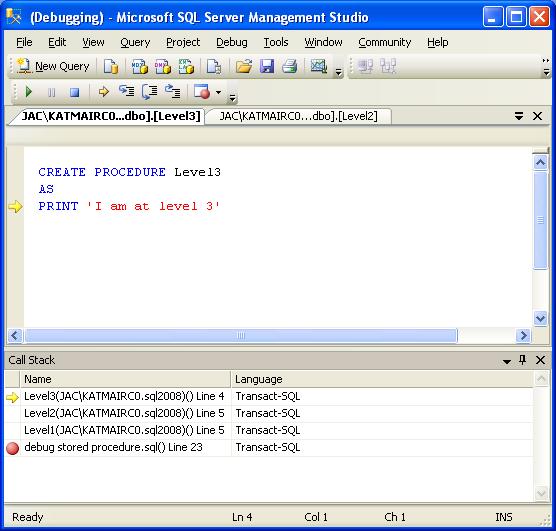
You can drill down to other child stored procedures, functions etc being called from your stored procedure.
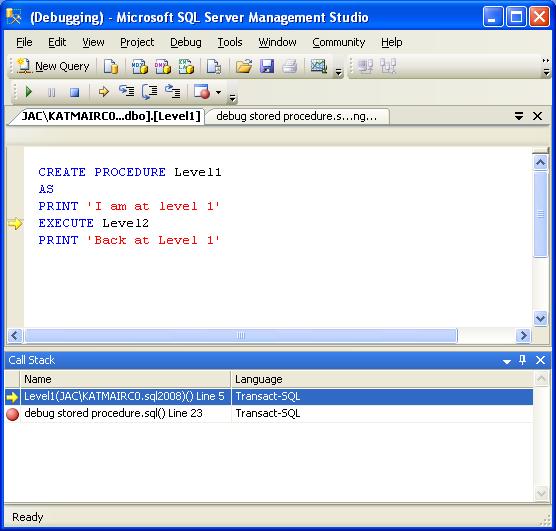
The "Call Stack" window will show the call stack that will help you to keep track of the execution path.
Debugging Functions
SSMS supports debugging functions too. To debug a function, select the TSQL statement that calls the function and click "start debugging" or press "ALT+F5".
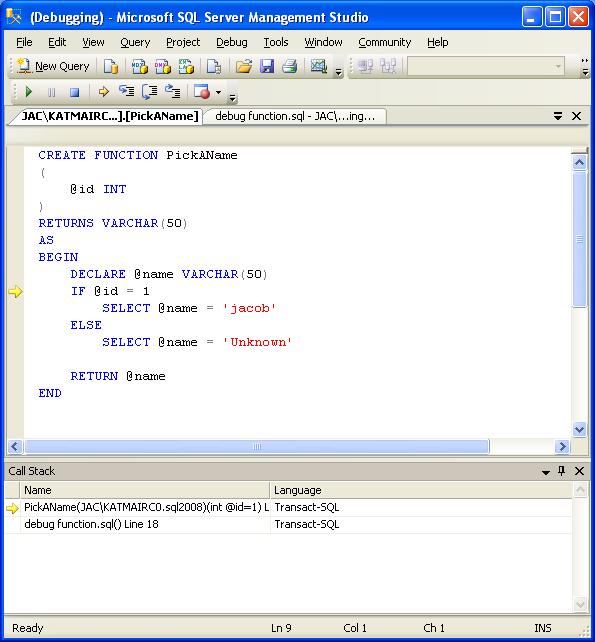
Previously, people used to debug stored procedures using PRINT or SELECT statements. So when your stored procedure behaves in unexpected manner, you could embed some PRINT or SELECT statements and find out what is going wrong with the code. However, when something goes wrong with a function, it was harder to identify.
The SSMS debugging support makes this job easier.
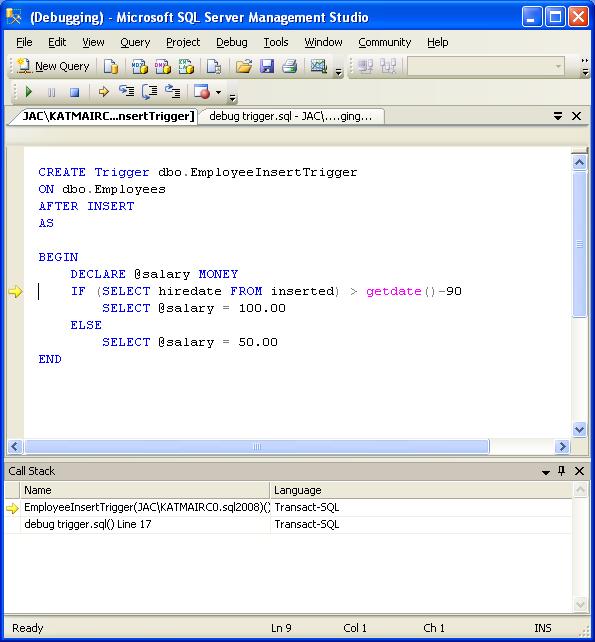
Debugging Triggers
Just like functions, triggers were difficult to debug too. People used to debug triggers using print statements or temp tables. SSMS makes it lot easier now. You can debug an INSERT/UPDATE/DEBUG statement and it will take you to the body of the triggers and you can step through the code.
Conclusions
Debugging is something that every developer does quite a lot of times. In this session, I did not go deeper into debugging. My intention is to give a few hints and I am sure you will be able to dive deeper into it. While debugging, if I find some more interesting stuff, I will come back with another session on SSMS debugging. Till then, "Happy Debugging!".

