


This is part 1 of an 8 part series of articles about speeding up access to a SQL Server database. This series is based on chapter 8 "Speeding up Database Access" of my book ASP.NET Site Performance Secrets, available at amazon.com and other book sites.
In parts 1 and 2 we'll see how to pinpoint any bottlenecks, such as missing indexes, expensive queries, locking issues, etc. This allows you to prioritize the biggest bottlenecks. Parts 3 through 8 than show how to fix those bottlenecks:
- Part 1 Pinpointing missing indexes and expensive queries
- Part 2 Pinpointing other bottlenecks
- Part 3 Fixing missing indexes
- Part 4 Fixing expensive queries
- Part 5 Fixing locking issues
- Part 6 Fixing execution plan reuse
- Part 7 Fixing fragmentation
- Part 8 Fixing memory, disk and CPU issues
Missing Indexes and Expensive Queries
You can greatly improve the performance of your queries by reducing the number of reads executed by those queries. The more reads you execute, the more you potentially stress the disk, CPU and memory. Secondly, a query reading a resource normally blocks another query from updating that resource. If the updating query has to wait while holding locks itself, it may then delay a chain of other queries. Finally, unless the entire database fits in memory, each time data is read from disk, other data is evicted from memory. If that data is needed later, it then needs to be read back from the disk. again
The most effective way to reduce the number of reads is to create enough indexes on your tables. Just as an index in a book, a SQL Server index allows a query to go straight to the table row(s) it needs, rather than having to scan the entire table. Indexes are not a cure all though - they do incur overhead and slow down updates - so they need to be used wisely.
In this part, you'll see:
- How to identify missing indexes that would reduce the number of reads in the database.
- How to identify those queries that create the greatest strain - either because they are used very often or because they are just plain expensive.
- How to identify superfluous indexes that take resources but provide little benefit.
Missing Indexes
SQL Server allows you to put indexes on table columns, to speed up WHERE and JOIN statements on those columns. When the query optimizer optimizes a query, it stores information about those indexes it would have liked to have used, but weren't available. You can access this information with the dynamic management view (DMV) dm_db_missing_index_details:
select d.name AS DatabaseName, mid.*
 from sys.dm_db_missing_index_details mid
  join sys.databases d ON mid.database_id=d.database_id
The most important columns returned by this query are:
| Column | Description |
|---|---|
| DatabaseName | Name of the database this row relates to. |
| equality_columns | Comma separated list of columns used with the equals operator, such as: column = value |
| inequality_columns | Comma separated list of columns used with a comparison operator other than the equals operator, such as: column > value |
| included_columns | Comma separated list of columns that could profitably be included in an index. Included columns will be discussed in part 3 "Missing Indexes". |
| statement | Name of the table where the index is missing. |
This information is not persistent - you will lose it after a server restart.
Don't take the results of dm_db_missing_index_details as gospel. Not all indexes that it suggests would actually be useful, some are duplicates, etc.
An alternative is to use Database Engine Tuning Advisor, which comes with SQL Server 2008 (except for the Express version). This tool analyzes a trace of database operations and attempts to identify an optimal set of indexes that takes the requirements of all queries into account. It even gives you the SQL statements needed to create the missing indexes it identified.
This all sounds great, but keep in mind that Database Engine Tuning Advisor will sometimes come up with the wrong indexes and miss good indexes. Before you make any changes, read part 3 "Fixing missing indexes" first.
The first step is to get a trace of database operations during a representative period. If your database is busiest during business hours, that is probably when you want to run the trace:
1. Start SQL Profiler. Click Start | Programs | Microsoft SQL Server 2008 | Performance Tools | SQL Server Profiler.
2. In SQL Profiler, click File | New Trace.
3. Click the Events Selection tab.
4. You want to minimize the number of events captured, to reduce the load on the server. Deselect every event, except SQL:BatchCompleted and RPC:Completed. It is those events that contain resource information for each batch, and so are used by Database Engine Tuning Advisor to analyze the workload. Make sure that the TextData column is selected for both events.
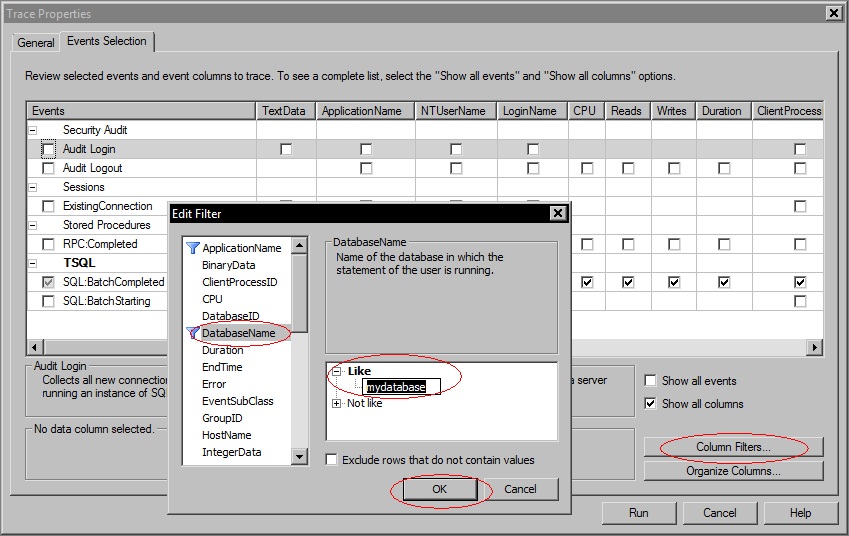
5. To only capture events related to your database, click the Column Filters button. Click DatabaseName in the left column, expand Like in the right hand pane and enter your database name. Click OK.
6. To further cut down the trace and only trace calls from your web site, put a filter on ApplicationName, so only events where this equals the Application Name you set in the connection string will be recorded. If you didn't set the Application Name in the connection string, use ".Net SqlClient Data Provider".
7. Click the Run button to start the trace. You will see batch completions scrolling through the window. At any stage, you can click File | Save or press ctrl-S to save the trace to a file.
8. Save the template, so you don't have to recreate it next time. Click File | Save As | Trace Template. Fill in a descriptive name and click OK. Next time you create a new trace by clicking File | New Trace, you can retrieve the template from the Use the template dropdown.
Sending all these events to your screen takes a lot of server resources. You probably won't be looking at it all day anyway. The solution is to save your trace as a script and then use that to run a background trace. You'll also be able to reuse the script later on.
9. Click File | Export | Script Trace Definition | For SQL Server 2005 - 2008. Save the file with a .sql extension. You can now close SQL Server Profiler, which will also stop the trace.
10. In SQL Server Management Studio, open the .sql file you just created. Find the string InsertFileNameHere and replace it with the full path of the file where you want the log stored. Leave off the extension, the script will set it to .trc. Press ctrl-S to save the .sql file.
11. To start the trace, press F5 to run the .sql file. It will tell you the traceid of this trace.
12. To see the status of this trace and any other traces in the system, in a query window execute the command:
select * from ::fn_trace_getinfo(default)
Find the row with property 5 for your traceid. If the value column in that row is 1, your trace is running. The trace with traceid 1 is a system trace.
13. To stop the trace after it has captured a representative period, assuming your traceid is 2, run the command:
exec sp_trace_setstatus 2,0
To restart it, run:
exec sp_trace_setstatus 2,1
14. To stop and close it, so you can access the trace file, run:
exec sp_trace_setstatus 2,0
exec sp_trace_setstatus 2,2
Now run Database Engine Tuning Advisor:
1. Start SQL Profiler. Click Start | Programs | Microsoft SQL Server 2008 | Performance Tools | Database Engine Tuning Advisor.
2. In the Workload area, select your trace file. In the Database for workload analysis dropdown, select the first database you want analyzed.
3. Under Select databases and tables to tune, select the databases for which you want index recommendations.
4. Especially with a big trace, Database Engine Tuning Advisor may take a long time to do its analysis. On the Tuning Options tab, you can tell it when to stop analyzing. This is just a limit, if it is done sooner, it will produce results as soon as it is done.
5. To start the analysis, click the Start Analysis button in the toolbar.
Keep in mind that Database Engine Tuning Advisor is just a computer program. Consider its recommendations, but make up your own mind. Be sure to give it a trace with a representative workload, otherwise its recommendations may make things worse rather than better. For example, if you provide a trace that was captured at night when you process few transactions but execute lots of reporting jobs, its advice is going to be skewed towards optimizing reporting, not transactions.
Expensive Queries
If you use SQL Server 2008 or higher, you can use the activity monitor to find recently executed expensive queries. In SSMS, right click your database server (normally in the top left corner of the window) and choose Activity Monitor.
You can get a lot more information by using the DMV dm_exec_query_stats. When the query optimizer creates the execution plan for a query, it caches the plan for reuse. Each time a plan is used to execute a query, performance statistics are kept. You can access those statistics with dm_exec_query_stats:
SELECT
 est.text AS batchtext,
 SUBSTRING(est.text, (eqs.statement_start_offset/2)+1,
 (CASE eqs.statement_end_offset WHEN -1
 THEN DATALENGTH(est.text)
 ELSE eqs.statement_end_offset END -
 ((eqs.statement_start_offset/2) + 1))) AS querytext,
 eqs.creation_time, eqs.last_execution_time, eqs.execution_count,
 eqs.total_worker_time, eqs.last_worker_time,
 eqs.min_worker_time, eqs.max_worker_time,
 eqs.total_physical_reads, eqs.last_physical_reads,
 eqs.min_physical_reads, eqs.max_physical_reads,
 eqs.total_elapsed_time, eqs.last_elapsed_time,
 eqs.min_elapsed_time, eqs.max_elapsed_time,
 eqs.total_logical_writes, eqs.last_logical_writes,
 eqs.min_logical_writes, eqs.max_logical_writes,
 eqs.query_plan_hash
FROM
 sys.dm_exec_query_stats AS eqs
 CROSS APPLY sys.dm_exec_sql_text(eqs.sql_handle) AS est
ORDER BY eqs.total_physical_reads DESC
A limitation of this DMV is that when you run it, not all queries that have run since the last server restart will have a plan in cache. Some plans may have expired due to disuse. Plans that were very cheap to produce, but not necessarily cheap to run, may not have been stored at all.
Another limitation is that as it stands, this query is only suitable for stored procedures. If you use ad hoc queries, the parameters are embedded in the query, so the query optimizer produces a plan for each set of parameters, unless the query has been parameterized. This is further discussed in part 6 "Fixing execution plan reuse".
To get around this, dm_exec_query_stats returns a column query_plan_hash which is the same for each query that has the same execution plan. By aggregating on this column using GROUP BY, you can get aggregate performance data for queries that share the same logic.
It makes sense to not only look at the cost of running a query once, but also at how often it runs. A very expensive query that runs once a week is less important than a moderately expensive query that runs 100 times per second.
The query returns this information:
| Column | Description |
| batchtext | Text of the entire batch or stored procedure containing the query. |
| querytext | Text of the actual query. |
| creation_time | Time that the execution plan was created. |
| last_execution_time | Last time the plan was executed. |
| execution_count | Number of times the plan was executed after it was created. This is not the number of times the query itself was executed - its plan may have been recompiled at some stage. |
| total_worker_time | Total amount of CPU time, in microseconds, that was consumed by executions of this plan since it was created. |
| last_worker_time | CPU time, in microseconds, that was consumed the last time the plan was executed. |
| min_worker_time | Minimum CPU time, in microseconds, that this plan has ever consumed during a single execution. |
| max_worker_time | Maximum CPU time, in microseconds, that this plan has ever consumed during a single execution. |
| total_physical_reads | Total number of physical reads performed by executions of this plan since it was compiled. |
| last_physical_reads | Number of physical reads performed the last time the plan was executed. |
| min_physical_reads | Minimum number of physical reads that this plan has ever performed during a single execution. |
| max_physical_reads | Maximum number of physical reads that this plan has ever performed during a single execution. |
| total_logical_writes | Total number of logical writes performed by executions of this plan since it was compiled. |
| last_logical_writes | Number of logical writes performed the last time the plan was executed. |
| min_logical_writes | Minimum number of logical writes that this plan has ever performed during a single execution. |
| max_logical_writes | Maximum number of logical writes that this plan has ever performed during a single execution. |
| total_elapsed_time | Total elapsed time, in microseconds, for completed executions of this plan. |
| last_elapsed_time | Elapsed time, in microseconds, for the most recently completed execution of this plan. |
| min_elapsed_time | Minimum elapsed time, in microseconds, for any completed execution of this plan. |
| max_elapsed_time | Maximum elapsed time, in microseconds, for any completed execution of this plan. |
An alternative to using dm_exec_query_stats is to analyze the trace you made with SQL Server Profiler. After all, this contains performance data for every completed batch. A batch corresponds to a stored procedure, or a query if you use ad hoc queries.
To investigate this a bit further, load the trace file into a table. You can use Profiler to do this:
1. Start SQL Profiler. Click Start | Programs | Microsoft SQL Server 2008 | Performance Tools | SQL Server profiler.
2. To open the trace file, click File | Open | Trace File, or press ctrl-O. If you want, you can now analyze the trace in Profiler.
3. To save the trace to a table, click File | Save As | Trace Table. If the table you specify does not yet exist, Profiler will create it.
Alternatively, use fn_trace_gettable, like this:
SELECT * INTO newtracetable

FROM ::fn_trace_gettable('c:\trace.trc', default)
The most obvious way to find the most expensive queries or stored procedures is to aggregate the performance data in the table by query or stored procedure, using GROUP BY. However, when you have a look at the TextData column in the table with trace results, you'll find all queries or stored procedure calls are listed with actual parameter values. To aggregate them, you'll have to filter out those values.
If you send stored procedure calls to the database, good on you. In that case, it isn't too hard to remove the parameters, because they always come after the stored procedure name. Here is a sql script that does exactly that and then aggregates the performance data per stored procedure (stored procedures are discussed further in part 6, which is about execution plan reuse):
-- This code assumes that table newtracetable holds trace information
-- produced by SQL Server Profiler.
-- It also assumes that all lines have a stored procedure call in the
- TextData field, of the form
- exec sprocname param1 param2 ...
--
-- This code first produces an intermediate table sprocdata, with the
-- parameters removed from the stored procedure calls.
-- It then produces a table sprocaggregateddata with aggregated CPU,
-- reads, writes and duration info per stored procedure.
IF EXISTS(select * FROM sys.objects WHERE name='fnSprocName' AND type='FN')
 DROP FUNCTION fnSprocName
GO
CREATE FUNCTION fnSprocName
(
 @textdata nvarchar(4000)
)
RETURNS nvarchar(100)
AS
BEGIN
 DECLARE @spaceidx int
 SET @spaceidx = CHARINDEX(' ', @textdata, 6)

 IF @spaceidx > 0
 RETURN SUBSTRING(@textdata, 6, @spaceidx - 5)
 RETURN RIGHT(@textdata, LEN(@textdata) - 5)
END
GO
IF EXISTS(select * FROM sys.objects WHERE name='sprocdata' AND type='U')
 DROP TABLE sprocdata
GO
SELECT dbo.fnSprocName(TextData) AS SprocName, CPU, Reads, Writes, Duration
INTO sprocdata
FROM newtracetable
CREATE CLUSTERED INDEX [IX_sprocdata] ON [dbo].[sprocdata]([SprocName] ASC)
IF EXISTS(select * FROM sys.objects WHERE name='sprocaggregateddata' AND type='U')
 DROP TABLE sprocaggregateddata
GO
SELECT
 SprocName,
 MIN(CPU) AS MinCpu, MAX(CPU) AS MaxCpu, AVG(CPU) AS AvgCpu, SUM(CPU) AS SumCpu,
 MIN(Reads) AS MinReads, MAX(Reads) AS MaxReads, AVG(Reads) AS AvgReads, SUM(Reads) AS SumReads,
 MIN(Writes) AS MinWrites, MAX(Writes) AS MaxWrites, AVG(Writes) AS AvgWrites, SUM(Writes) AS SumWrites,
 MIN(Duration) AS MinDuration, MAX(Duration) AS MaxDuration, AVG(Duration) AS AvgDuration, SUM(Duration) AS SumDuration
INTO sprocaggregateddata
FROM sprocdata
GROUP BY SprocName
SELECT * FROM sprocaggregateddata
If you send ad hoc queries, removing the variable bits of the queries will be a lot harder, because their locations are different for each query. The following resources may make your job a bit easier:
- SQL Nexus Tool - Recommended free tool that helps find the most expensive queries
- Trace-scrubbing Tools
Once you've identified the most expensive queries, you can find out whether adding indexes would speed up their execution.
1. Open a query window in SSMS.
2. From the Query menu, choose Include Actual Execution Plan. Or press ctrl+M.
3. Copy an expensive query in the query window and execute it. Above the results pane, you will see a tab Execution plan. Click that tab.
4. If the query optimizer found that an index was missing, you will see a message in green.
5. For more information, right click in the lower pane and choose Show Execution Plan XML. In the XML, look for the MissingIndexes element.
If you identified missing indexes, in part 3 you'll see how indexes work and how to create them. If you found any particularly expensive queries, in part 4 you'll find how to fix those.
Unused Indexes
Indexes not only speed up reads, they also slow down updates and take storage space. If an index slows down updates but is little or not used for reading, you're better off dropping it.
Use the DMV dm_db_index_usage_stats to get usage information on each index:
SELECT d.name AS 'database name', t.name AS 'table name', i.name AS 'index name', ius.*
 FROM sys.dm_db_index_usage_stats ius
 JOIN sys.databases d ON d.database_id = ius.database_id AND ius.database_id=db_id()
 JOIN sys.tables t ON t.object_id = ius.object_id
 JOIN sys.indexes i ON i.object_id = ius.object_id AND i.index_id = ius.index_id
 ORDER BY user_updates DESC
This gives you the name and table of each index in the current database that has seen activity since the last server restart, and the number of updates and reads since the last server restart. Specifically, the DMV sys.dm_db_index_usage_stats shows how many times the query optimizer used an index in an execution plan. You'll find the number of updates caused by INSERT, UPDATE or DELETE operations in column user_updates, while the number of reads is in columns user_seeks, user_scans and user_lookups. If the number of updates is high in relation to the number of reads, consider dropping the index, like this:
DROP INDEX IX_Title ON dbo.Book
You may see clustered indexes being updated. In part 3, we'll see how the table itself is part of the clustered index - which means that any table update is also an update of the clustered index.
Conclusion
In this part, we saw how to pinpoint missing indexes and expensive queries through a number of DMVs and SQL Server Profiler. In part 2, we'll see how to pinpoint additional bottlenecks, such as locking and fragmentation issues.
From the Book
This article is taken from Chapter 8 of ASP.NET Site Performance Secrets. Click the image or link to get your copy at Amazon.


