

Introduction
I still remember it was a neatly done report that got me my first
pay raise. Ever since, I am very passionate about report writing (every one
likes pay raise right?). In this article, I will guide you through step by step
how to create a simple report using MS Reporting Services 2005; and host
it with a Smart Client application.
So, are you ready to get your pay raise? Why not! Who knows, your neatly done report can just do that.
Prior to this article, I wrote three others, which were addressing different issues related to the reporting services. However, all of them were targeted towards the intermediate-advance level audience. From all the feedback I received, one was common: quite a few of you asked for an article which will be specially geared towards the novice-beginner level.
I assume the reader has the basic understanding of the Visual Studio 2005 IDE and comfortable with writing code using C#. You dont have to know the MS Reporting Services to understand this article; although, any pervious experience with the report writing would help to fast track yourself.
Although, I am calling this article 101, my intention is to adopt the applied approach rather then discussing each and every topic associated with reporting services. I am touching on most common aspect of report designing with most commonly used controls. I would strongly encourage you to please go through MSDN documentation for more detailed information.
Lets roll up our sleeves, its reporting time
Please take a look at Image 1. How complex is that
report? How much time do you think it will take to create such a report?
Well, as for complexity, it is a simple report extracted out of source NorthWind->Products
(SQL Server 2000) and lists all the products information with summary
totals.
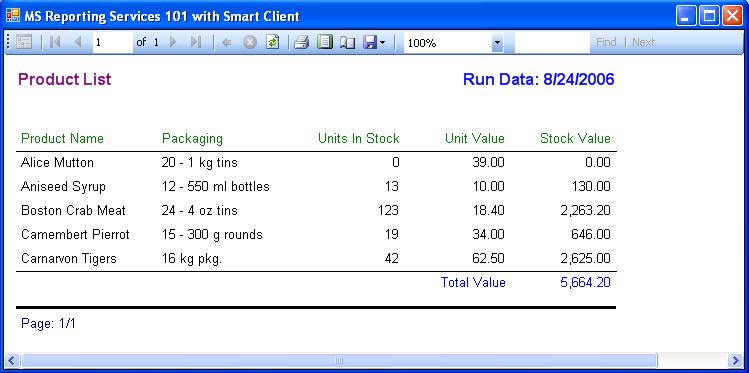
Image: 1
About time, obviously, it should not take you hours to do it.
About R&D and trial & error time, I leave that to you; dig down deep;
the deeper you will explore, the better the treasure you will find.
Here it is, the million $ question: How to start? What is going to
be the first step?
Often, it is very easy to find out what should be the first step.
Have you seen a house built before the foundation? No! So, have I given you a
hint here? Sure, we must first develop the Smart Client to host our report.
Step 1: Create Windows Application Project
Please do the following to create a Windows Application (Smart Client) project:
- Select File menu -> New -> Project.
- Choose C# from Project Types pane.
- In the Templates pane, choose Windows
Application for Visual C# projects.
In the Name box, name the project something unique (I named the
attached project code rsWin101) to indicate the application's purpose.
In the Location box, enter the directory in which you want to save your project,
or click the Browse button to navigate to it. Once you are done, you will find
Form1 added to the project and you can start working on it using Forms
Designer.
Please update following properties of Form1:
Form1.Text = "MS Reporting Services 101 with Smart Client"
Form1.Size = 750, 300
Feel free to change any other property of Form1 as per your requirement.
Step 2: Add Report Viewer to the Form
So, what is report viewer? As we need the DVD player to play a DVD; same goes with the reports, we need a report viewer to have the report preview done.
For all those who are brand new to report writing, I would say, report viewer gives life to your reports. It not only previews you the output, further, it also facilitates you to generate the information in the various popular formats (pdf, excel etc.). You can also take a hard copy print of the report while you are viewing the output.
Please perform following actions to setup Report Viewer Control on Form1:
- Drag ToolBox -> Data -> ReportViewer and drop it on Form1. This step will create a new instance of ReportViewer with name reportViewer1. I always wanted to name reportViewer1 to rpvAbraKaDabra, hence, wont let this chance pass by now. As I picked rpvAbraKaDabra, feel free to pick yours, let those imagination horses run wild!
- By setting reportViewer1.Dock = Fill, report viewer will fill the entire surface of form for report display purpose.
After step 1 and step 2, your project should look as per Image 2.
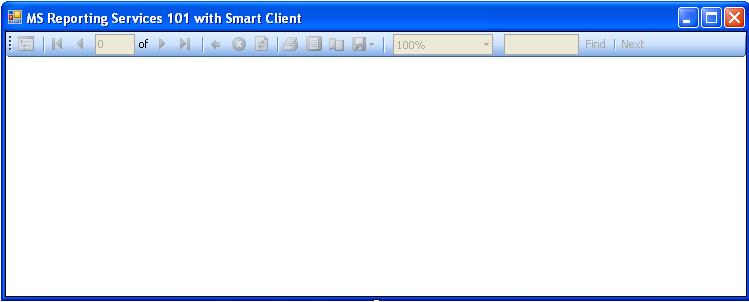
Image: 2
Step 3: Add DataSet to the Project
Hurray! We are done with the foundation. Its time to put walls around the foundation; eventually these walls will hold the doors and windows of your home. DataSet is just that for Report Viewer, it holds and provides the raw data from data source to be processed and ready to be outputted on the Smart Client interface.
Following step is required to have DataSet added to project:
- Select Add -> New Item -> DataSet from
Solution Explorer. Change name from DataSet1 to dsProduct
and click on Add button to complete the action.
Lets add a DataTable to our newly created DataSet.
DataTable is essential to load the reporting data; we will use the
information from DataSet/DataTable while designing the report.
Following step are required to have DataTable added to DataSet(dsProduct):
- Double click on dsProduct from Solution Explorer;
it will open the designer view. Right-click on the designer surface and Add
-> DataTable. Please click on header and change the name to
dtProductList. Please see Image 3.
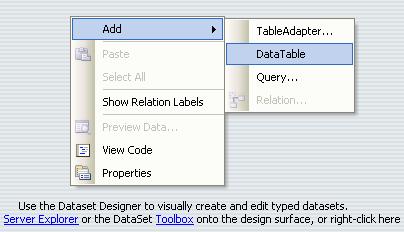
Image: 3
Lets start adding columns to DataTable(dtProductList). Your designer screen should look like Image 4. Right-click on dtProductList and select Add -> Column to start adding columns to DataTable.
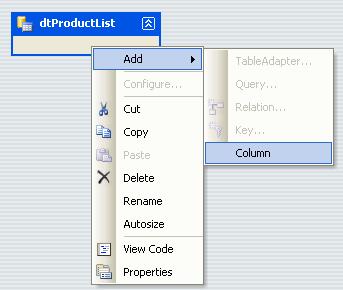
Image: 4
Please repeat the action for following columns:
- ProductName (String)
- QuantityPerUnit (String)
- UnitPrice (Double)
- UnitsInStock (Double)
- UnitValue (Double) A calculated field based on UnitsInStock
* UnitPrice
As you are adding columns, by default it is string data type.
Please go to properties windows after selecting column to change it from String
to Integer or Double.
Please see image 5. Your DataTable should look the
same. Also, you can see the properties window to change the data type.
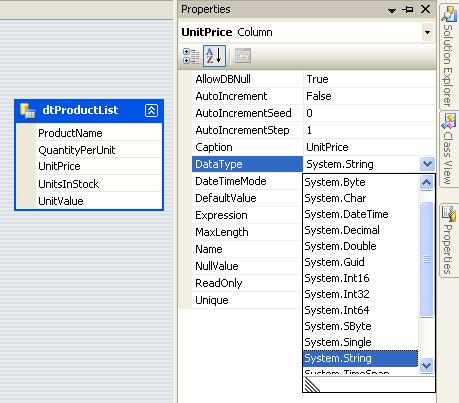
Image: 5
Have you heard of Typed DataSet? If not, then we have just created a Typed DataSet here. Please consult online help to know more about Typed DataSet.
Step 4: Add Report to the Project
All right, so far we created the project; added Report Viewer and DataSet. Now, it is the time to deal with star of the show! Lets create that neat report.
Following steps is required to have Report (rptProductList.rdlc):
- Select Add -> New Item -> Report from
Solution Explorer. Change name from Report1.rdlc to rptProductList.rdlc
and click on Add button to complete the action.
Typically, after add action is finished your screen should be
similar to Image 6. When a report is added to project, it is ready to
use the DataSet for designing.
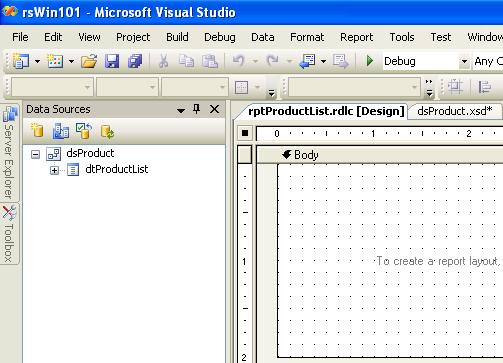
Image: 6
Weather this is your very first report or you are a reporting junkie like me; we have to deal with the most basic building blocks of report writing, which is: Header, Body and Footer.
Typically, reports are designed with specific page size and layout in mind. Our report is Letter size and Portrait layout. You can explore various properties attached to report layout by right clicking anywhere on open designer surface and select properties.
It is always advisable to draw a prototype of your report on paper, before you start the design attempt. As you can see in Image 1, we have Report Name and Report Date in header section. The body section has the product list information together with summary totals; and footer carries the Page Numbers.
Lets start working on Page Header:
When new report is added to project, by default, all you will see in report designer is the body section. Right click on report designer surface anywhere other then body and select Page Header. This will add header to report. Feel free to adjust the height of header and body section. See Image 7, I have reduced the height of body and increased the height of the header.
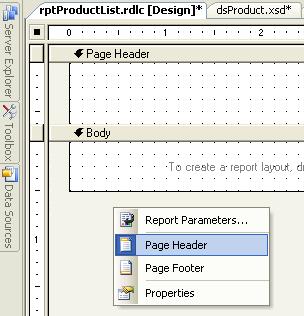
Image: 7
While inside the report designer, if you explore the Toolbox, you will see variety of controls which can be used to design report. For our example, we will use, TextBox, Line and Table control. I would encourage you to go through the online documents if you need detailed information for all available controls.
Header Section
Lets start designing the header. We will start by dragging two TextBox and dropping on header section. Texbox can show both static and dynamic data. Line control is used to separate header from body section.
After dropping controls over report designer surface, you can control the look and feel by changing associated properties. We will designate one TextBox to report title and another one to show current date. We can directly type static text into TextBox control by selecting it and start typing inside.
Please change following properties of Title TextBox:
Value = "Product List"
Color = Purple (you like purple for title, right?)
Please change following properties of Date TextBox:
Value = ="Run Data: " & Today
Color = Purple (you like purple for title, right?)
Please note Value property for Date TextBox starts with a = sign. This is not a simple static text, instead it is an expression. This expression is a result of string Run Date and VB.NET script keyword Today (to get current system date).
You can specify desired names to all objects in report; I choose to stay with default name for most of the controls, however, for demo purpose I did specified txtTitle to Title TextBox.
Please refer to Image 8; your finished design for header should look relatively same.
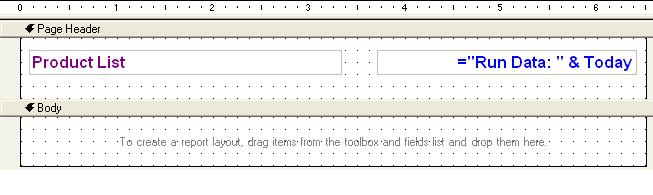
Image: 8
Body Section
The Body section, also referred as details section, is by far the most important part of the report. As you can see when we added the report to the project; body section was added for us automatically. All we have to do is start putting controls on it.
Traditionally the Body section is used to display details (in our example it is product information) usually more then one row of information.The Body section can expand as per the growth of reported data. Often report is designed with intention to have one physical page (Letter/A4 etc.) output; in this case Body section still can be used to display information.
Out of Table, Matrix and List, the three most commonly used control on Body section; we will use Table control for our example. All three can repeat information; Matrix goes a step further and even produces Pivot output.
Lets drag and drop Table control on body section of report designer surface. If you notice, this action will produce a table with three rows and three columns. You may have also noticed that center column also has been labeled: Header, Detail and Footer.
Now, dont be surprise if I tell you that Table control is
nothing but bunch of TextBox attached together! Yes, each and every
Cell in Table is like TextBox, which means you can either type
static text on it or specify a dynamic expression.
Before we start designing the Body section, lets add two more
columns (remember we have total of five columns in the report). Adding columns
is easy; please do the following to get new columns added to report:
- Select Table Control inside Body section
- Click on right most column header (I assume we are
adding new columns to right side)
- Right click on header and select -> Insert
Column to the Right
Make sure your report resemble to Image 9. Feel free to
adjust the width of column based on length of data it will hold.
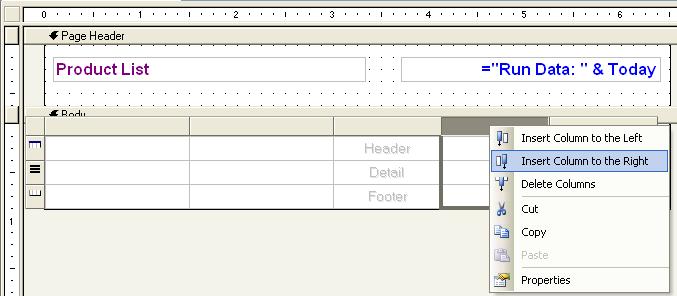
Image: 9
I am sure majority of us have used Excel or something similar;
think of same for Table control as mini worksheet. We can apply
borders, change font of individual cell etc. etc. So, all you have to do is to
think of desired formatting theme and start applying it.
Starting with first column to the last one, please click on
individual column header cell and type the following text:
Header 1: "Product Name"
Header 2: "Packaging"
Header 3: "Unit Price"
Header 4: "Units in Stock"
Header 5: "Stock Value"
Lets continue to do so the same for Detail section, here one
thing to know is, instead of text we have to type the expression which is
columns from dsProduct.dtProductInfo. You can either type the
expression or simply drag and drop the column from Data Sources Toolbar (see Image
7 on left side).
In case if you decide to type it out, starting with first column
to the last one, please click on individual column detail cell and type
the following text:
Detail 1: "=Fields!ProductName.Value"
Detail 2: "=Fields!QuantityPerUnit.Value"
Detail 3: "=Fields!UnitsInStock.Value"
Detail 4: "=Fields!UnitPrice.Value"
Detail 5: "=Fields!UnitsInStock.Value * Fields!UnitPrice.Value"
Please take notice of Detail 5: it is the calculated output by
performing multiplication of Units in Stock and Unit Value.
Tip: If you drag and drop the column to detail section of Table
control, it will try to add column header automatically, if column header is
empty.
Finally, lets add summary total in footer section of Table
control. Please make sure to select footer cell on column 4 and 5 inside Body
section and type following text:
Cell 4: "Total Value:"
Cell 5: "=SUM(Fields!UnitsInStock.Value * Fields!UnitPrice.Value)"
Please check the expression in Cell 5; I am using a built-in
function SUM() to find out total stock value of all the products listed
in report.
Footer Section
Before we start writing some cool C# code to bring our report
alive, lets finish the report footer section. As we have added report header
earlier, similarly we have to right click on open report designer surface and
select Page Footer (see Image 7).
Drag and drop a Line and TextBox control on Footer section. Please
type the following expression inside TextBox:
Value: ="Page: " & Globals!PageNumber & "/" & Globals!TotalPages
As you can see I have used PageNumber and TotalPages, both are Global variables maintained by the reporting engine.
Tip: Make sure all expression you type must start with = in front of it.
Please make sure your report looks like Image 10. As you can see I have introduced some color and right alignment to numeric data etc.Feel free to try out all the different formatting options, just think of Table control as mini spreadsheet with columns and rows and now you know all the formatting you can try on them.
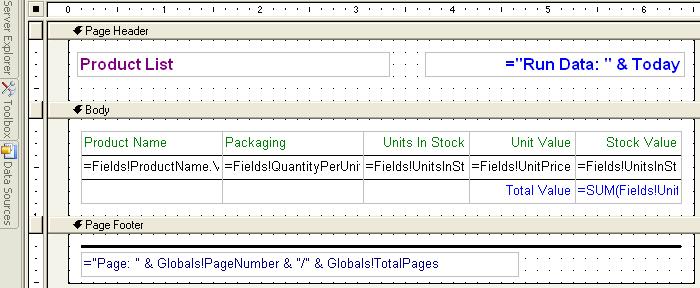
Image: 10
Expression Builder
Expression builder is a very powerful feature of Reporting
Services. As you can see in Image 11, Stock Value is calculated with
the help of SUM function. All fields in DataSet can be access with
Fields! keyword.
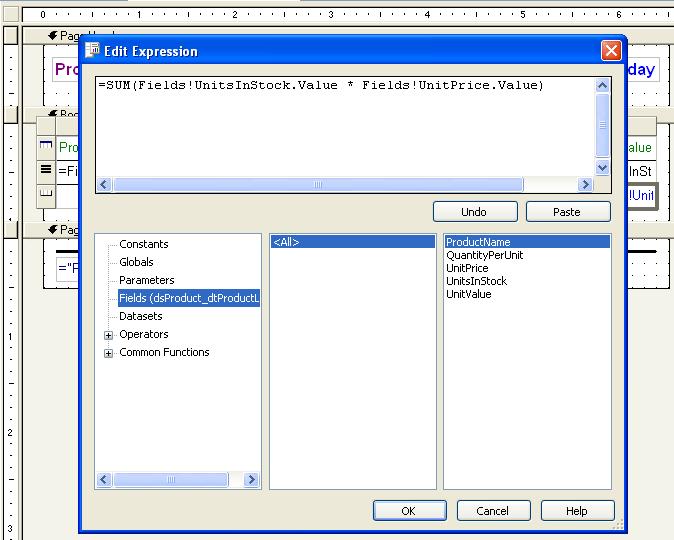
Image: 11
Step 5: Lets write some C# code to bring life to our report
Phew I hope you guys are not exhausted already. Hang in there;
we are on last step now. Its like we have waited for that long nine months
and the time has come to witness the miracle of birth.
From solution explorer, select Form1. Right click on surface of
form and select View Code.
using System.Data.SqlClient;
using Microsoft.Reporting.WinForms;
Make sure the Form1_Load event has following code:
private void Form1_Load(object sender, EventArgse) ( //declare connection string string cnString = @"(local); Initial Catalog=northwind;" + "User Id=northwind;Password=northwind"; //use following if you use standard security //string cnString = @"Data Source=(local);Initial //Catalog=northwind; Integrated Security=SSPI"; //declare Connection, command and other related objects SqlConnection conReport = new SqlConnection(cnString); SqlCommand cmdReport = new SqlCommand(); SqlDataReader drReport; DataSet dsReport = new dsProduct(); try { //open connection conReport.Open(); //prepare connection object to get the data through reader andpopulate into dataset cmdReport.CommandType = CommandType.Text; cmdReport.Connection = conReport; cmdReport.CommandText = "Select TOP 5 * FROM Products Order By ProductName"; //read data from command object drReport = cmdReport.ExecuteReader(); //new cool thing with ADO.NET... load data directly from reader to dataset dsReport.Tables[0].Load(drReport); //close reader and connection drReport.Close(); conReport.Close(); //provide local report information to viewer rpvAbraKaDabra.LocalReport.ReportEmbeddedResource = "rsWin101.rptProductList.rdlc"; //prepare report data source ReportDataSource rds = new ReportDataSource(); rds.Name = "dsProduct_dtProductList"; rds.Value = dsReport.Tables[0]; rpvAbraKaDabra.LocalReport.DataSources.Add(rds); //load report viewer rpvAbraKaDabra.RefreshReport(); } catch (Exception ex) { //display generic error message back to user MessageBox.Show(ex.Message); } finally { //check if connection is still open then attempt to close it if (conReport.State == ConnectionState.Open) { conReport.Close(); } } }
You might be wondering why I have used TOP 5 for select query; the reason is, I wanted to limit the output so that I can show you summary total in Image 1.
Tip: Name property of ReportDataSource object should be always DataSet_DataTable.
Conclusion
Although, I tried to keep the language of this article as simple
as possible; however, please feel free to get back to me if you need any
further clarification. I consider myself a budding author; I have to learn a
lot; it is the reader like you, who has always helped me to improve my writing.
I am looking forward to receive any comments/suggestion you have
for me.
Thank you for reading; I sincerely hope this article will help you
a bit or two to know reporting services better through my applied approach.
