Introduction
The purpose of this article is to give you an introduction to QlikView and show to how to setup your first QlikView document so you can see QlikView in action.
You will create your first QlikView document and use some random sales data and show how to create lists and a simple chart within QlikView.
What does QlikView actually do?
With QlikView you can analyze data in sources such as Excel Spreadsheets, Databases, or text files. You can create charts from your data, you can search through your data very quickly, you can explore your data easily which can help you make decisions or many just confirm what you thought.
QlikView is part of a category of software called ‘Business Intelligence’, because of this it is often compared with SSAS.
For example: If you are using data about the orders customers have placed you might want to answer the question ‘Which of my customers placed the largest total order in the last 6 months?’ QlikView makes it easier to answer such questions by allow you the ability to explore the data quickly.
Who produces QlikView?
Below are a few details about QlikTech
- QlikView was developed by a Swedish company called QlikTech.
- QlikTech was founded in 1993.
- QlikTech has over 24,000 customers.
- QlikTech has over 1000 Employees.
If you have never heard of QlikView or QlikTech before then hopefully the points above should satisfy you that QlikTech is by no means a small company.
Next we will look at getting the software and installing it on your computer.
QlikView Installation - A Free Download
The examples produced in this article were created using QlikView Personal Edition Version 11(QVPE) which is a free download.This is not a time limited product. QlikView Personal Edition can only open QlikView documents created with that copy of QlikView Personal Edition (QVPE).
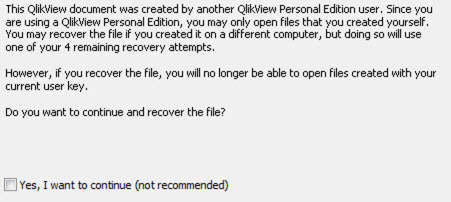
If you try to open QlikView documents created by another user you will get the following warning. If you select the option to recover this file you will no longer be able to open documents you created. As shown in the screenshot below :
If you wish to share QlikView documents with other users you need to obtain a license from QlikTech.
Here is the link to download the free QlikView Personal Edition. http://www.QlikView.com/us/explore/experience/free-download/
Once you can completed the form and downloaded the QlikView setup program, run the setup program making sure you select the correct language and change the location of the program if required.
Import your sales data into QlikView and start using QlikView
1. The data for this example can be downloaded from : http://practical-qlikview.com/Downloads.aspx
The document is called 'My First QlikView Document - Sales Data'. The file with the download is 'random data - excel.xls'. (Note: This is also available in the Resources section below).
2. If QlikView is not already open click on the Start button, go to ‘All Programs’, find the QlikView folder and click on the ‘QlikView 11’ application.
3. From the File Menu, select ‘New’.
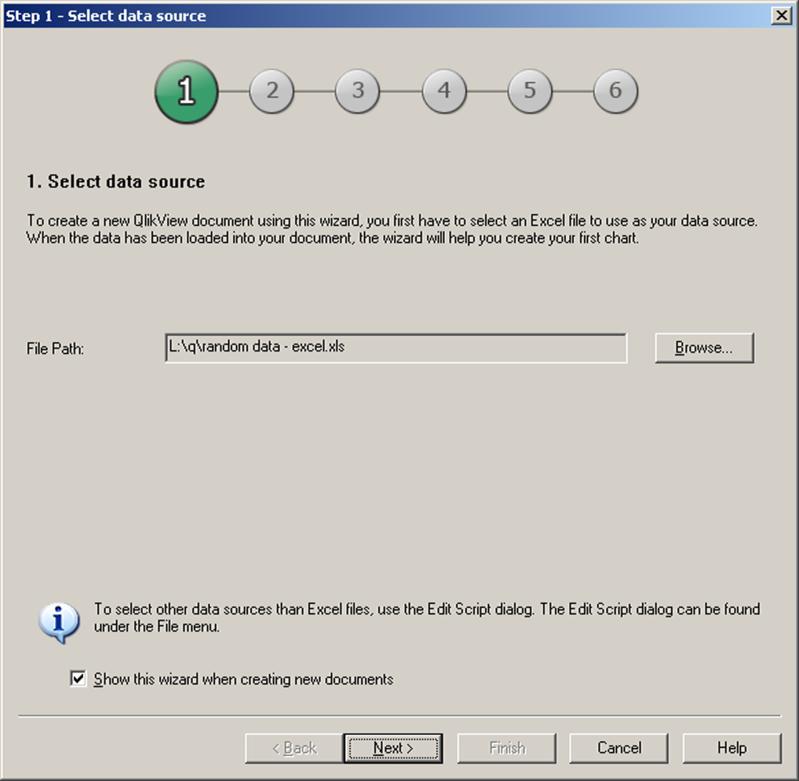
4. Browse to the Excel File where you created your sample sales data and select the file.
5. Click the Next button.
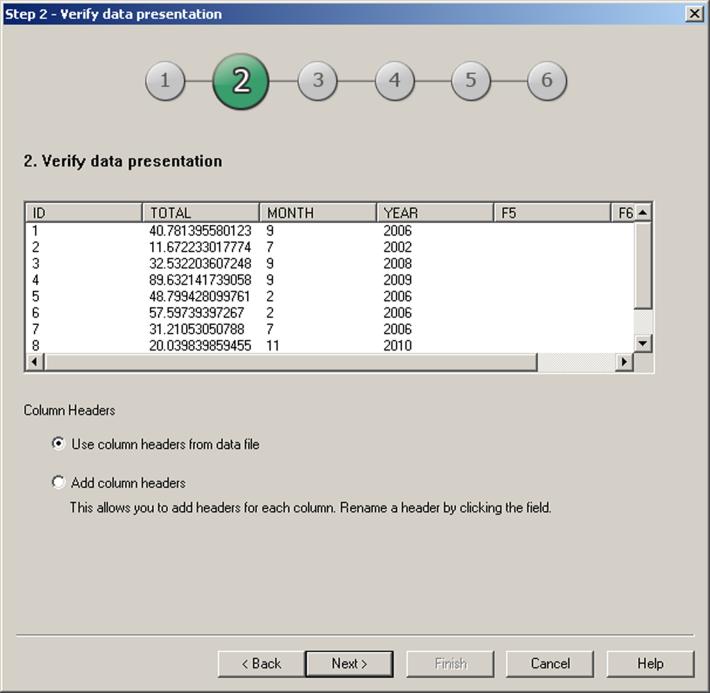
6. Select the option ‘Use column header from data file’.
7. This option will use the headers that you have already in your excel spreadsheet.
8. Click the Next button to continue.
9. Save your QlikView document and click Next. The file will end in .qvw.
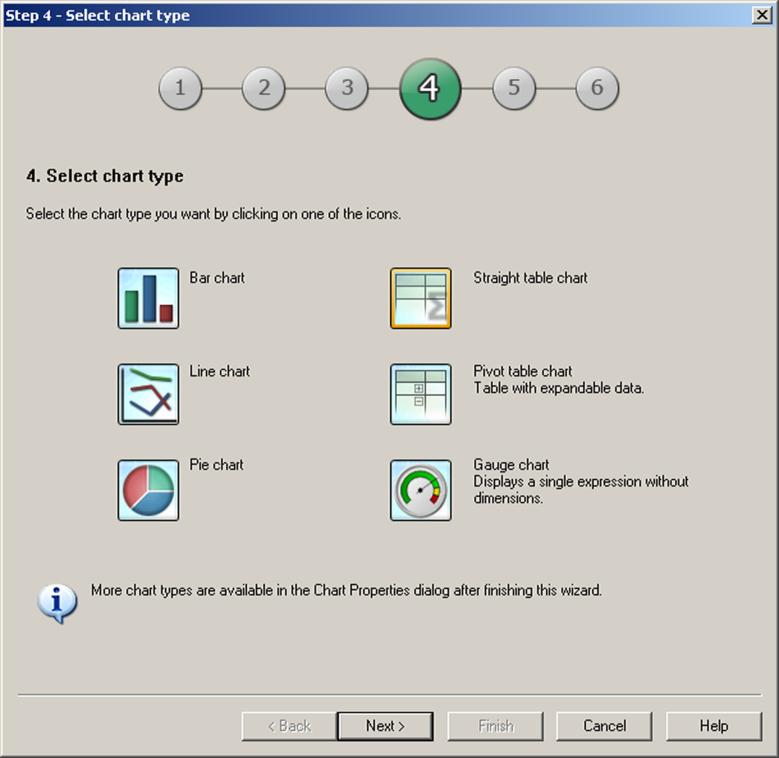
10. Select the ‘Straight table’ chart. This type of chart will display the data in the Excel spreadsheet that you created.
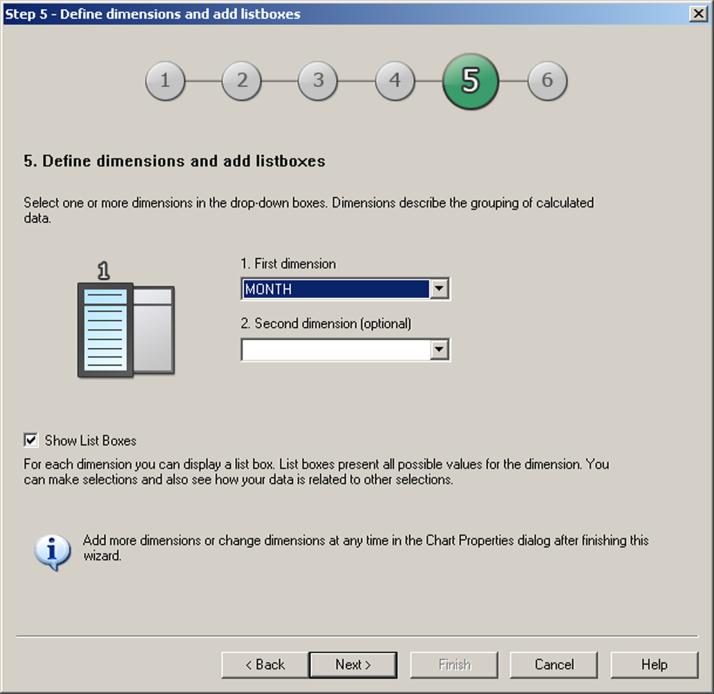
11. Select the dimension you wish to use to group the data.
12. Set the ‘First Dimension’ to MONTH.
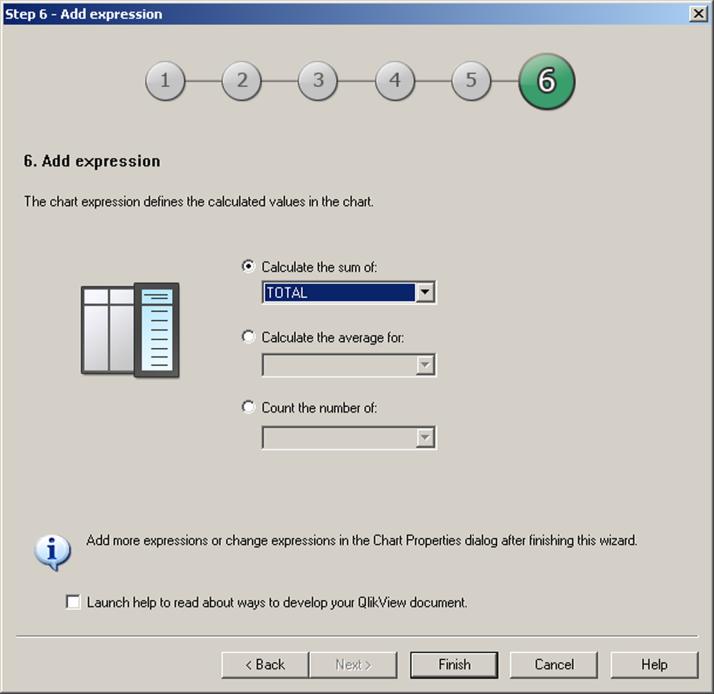
13. Set the ‘Calculate the sum of’ option to TOTAL.
14. This will display the sum of the TOTAL field.
15. Click on the Finish button.
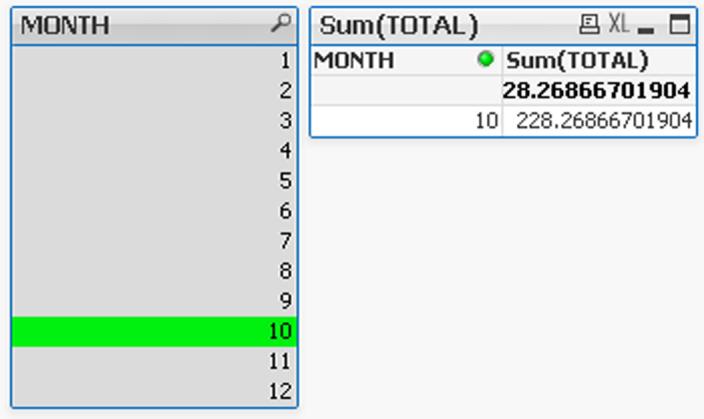
16. Below is a screenshot of what your first QlikView document should look like.
You will see the Month list and the ‘Straight Chart table’ contains the Sum of TOTAL values grouped by the Month Dimension.
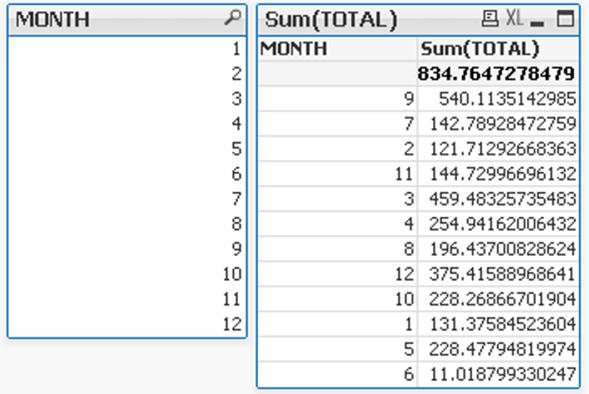
17. You can filter the values by selecting a MONTH value.
18. To remove the filter, click the ‘CLEAR’ button in the toolbar.
Next we will create a Bar Chart.
1. Right click on a blank area of the sheet.
2. Select ‘New Sheet Object’, then Chart.

The chart wizard will start.
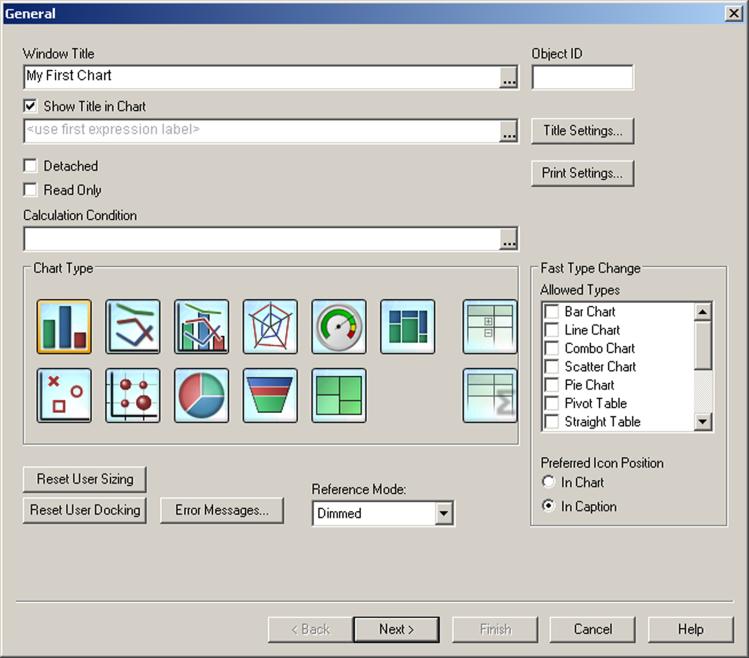
3. Enter a name in the Window Title textbox: My First Chart.
4. Select the icon for the Bar Chart in the ‘Chart Type’ area.
5. Click Next.
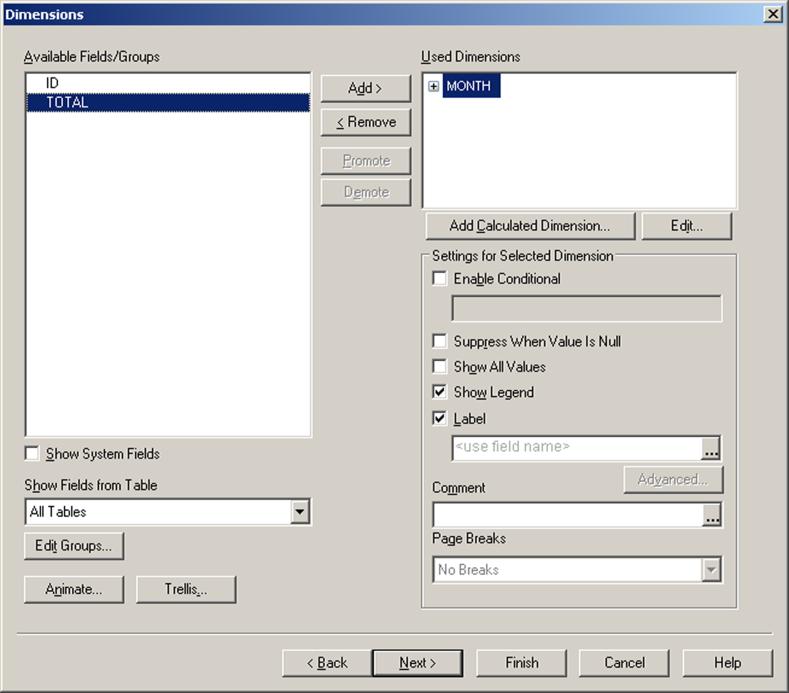
Dimensions
Dimensions determine how the data will be grouped in the chart (the X axis).
6. Select MONTH from the ‘Available Fields/Groups’ list and click the Add button so that the option is moved to the ‘Used Dimensions’ list.
7. Click Next.
Expressions
The expression will determine what value is plotted on the y-axis of the chart.
8. In this example we will use the sum of all the total values for each month.
9. In the ‘Edit Expression’ dialog enter the text:
SUM(TOTAL)
Where TOTAL is the name of the field in your table that contains the sales totals.

10. Click OK, then click on the Finish button and your chart will be displayed and should look similar to the screenshot below.
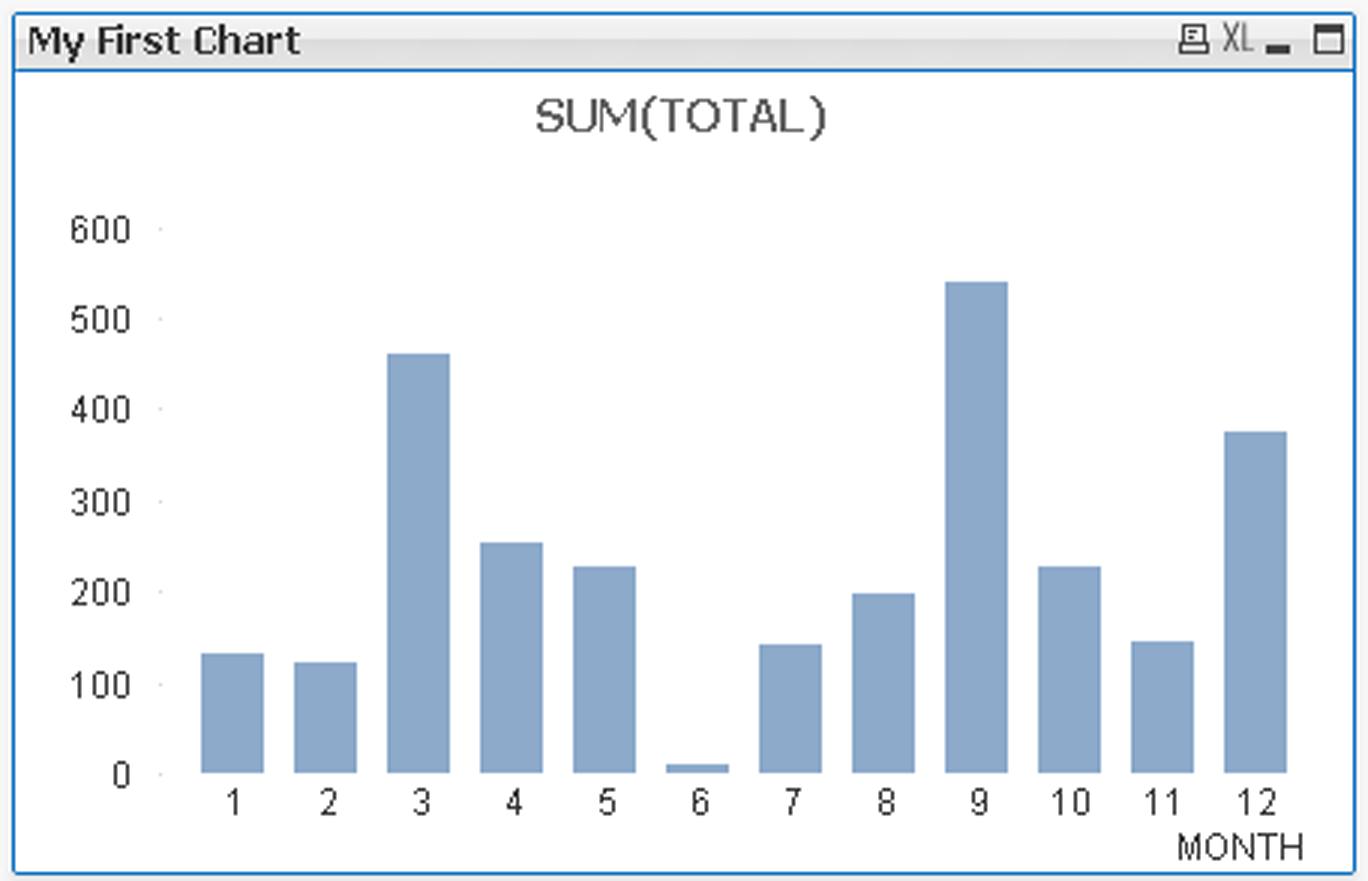
You can experiment with this QlikView document by selecting the months from the list to see that the chart is updated. You can select multiple months by holding down the CTRL key.
Conclusion
QlikView can use a useful tool to learn to use at work and home. I personally use QlikView at home to monitor by spending habits and dotnetnuke log files.
In some cases it is not the best tool to use, for example I would not try to use the reporting feature to print multiple page reports such as Invoices which I have developed in the past using SSRS.
From my experience users generally seem to like QlikView because it is fast (data load into memory), they can start using the documents with little training, they can export the data to Excel.
If this article proves to be of interest it would be useful to focus on creating QlikView documents using tables\views and stored procedures with articles focused on Sql Server.
http://www.practical-qlikview.com