

Introduction
The primary responsibility of a DBA is to ensure the availability and optimal performance of database systems. Admittedly, there are ancillary responsibilities; however, none supersede the basic duty of the DBA to maintain the database. As DBAs, there are a variety of tools available for us to monitor the performance of the databases for which we are responsible. From expensive enterprise-level tools, to free do-it-yourself solutions using the built-in monitoring capabilities of SQL Server and Windows, either approach provides the DBA with the necessary data to proactively manage the database systems, ensuring optimal performance and availability.
Proactive monitoring ensures that we, the DBAs, are in charge of any issues; identifying performance bottlenecks and usage trends in order to correct any issues before they become problems. After a performance problem surfaces, everyone has an opinion and a fix, often resulting in a kludge becoming a permanent feature of the system. Using real-time performance data to monitor the potential performance bottlenecks in the system, as well as analyzing collected historical performance data for trends, the DBA can ensure that most performance issues can be corrected before they become problems.
I am a great fan of SQL Profiler and PerfMon; however, this article will discuss proactive monitoring of SQL Server using Dynamic Management Views (DMV).
Performance Metrics
Too much information (TMI) is a phenomenon affecting much of society. While monitoring performance, I prefer a focused collection of metrics that allow a clear view of the performance of the SQL Server instance.The suggested metrics listed below support the monitoring of a database; if and when anomalous statistics are reported over a period of time, then more detailed counters / statistics, some of which are not listed, must be examined in order to discover the root cause.
Below is a list of suggested monitoring data which may be collected from DMVs, then stored and analyzed, in order to proactively manage a SQL Server instance.
| Metric | Description | DMV | Object/Column Name |
| Pages per Second | Number of pages written / read from or written to disk | sys.dm_os_performance_counters | Buffer Manager |
| Total SQL Server Memory | Total memory in use | sys.dm_os_performance_counters | Memory Manager |
| Buffer Cache Hit Ratio | Pages in buffer NOT requiring disk read | sys.dm_os_performance_counters | Buffer Manager |
| Average Latch Wait Time | Milliseconds latch requests waited | sys.dm_os_performance_counters | Latches |
| Free list stall/sec | Number of requests that had to wait for a free page | sys.dm_os_performance_counters | Buffer Manager |
| Memory Grants Pending | Processes waiting for memory | sys.dm_os_performance_counters | Resource Pool Stats |
| Page Life Expectancy | Number of seconds a page will stay in the buffer pool without references | sys.dm_os_performance_counters | Buffer Manager |
| Lazy Writes per Second | Number of buffers written per second by the buffer manager's lazy writer | sys.dm_os_performance_counters | Buffer Manager |
| Average Latch Wait Time | Milliseconds latch requests waited | sys.dm_os_performance_counters | Latches |
| Average Lock Wait Time | Milliseconds lock requests waited | sys.dm_os_performance_counters | Locks |
| Lock Waits per Second | Number of lock requests forced to wait | sys.dm_os_performance_counters | Locks |
| Deadlocks per Second | Lock requests resulting in deadlock | sys.dm_os_performance_counters | Locks |
| Log File Size | File size in KB | sys.dm_os_performance_counters | Databases |
| Data File Size | File size in KB | sys.dm_os_performance_counters | Databases |
| Log File Growth | Number of log growths | sys.dm_os_performance_counters | Databases |
| Percent Log Used | Log space percentage used | sys.dm_os_performance_counters | Databases |
| Log File Size Used | KB used | sys.dm_os_performance_counters | Databases |
| Physical Disk I/O | Read and write requests queued | sys.dm_os_schedulers | pending_disk_io_count |
| Transactions per Second | Transactions started per second | sys.dm_os_performance_counters | Databases |
| CPU Usage % | CPU utilization as a Percentage | sys.dm_os_performance_counters | Resource Pool Stats |
| User Connections | User connections to the instance | sys.dm_os_performance_counters | General Statistics |
Table 1 Performance Monitoring Metrics
A starting point must be defined for future efforts in order to effectively improve or maintain the performance of the instance. The metrics identified in Table 1 provide a perspective into the performance of SQL Server that may be used to create a baseline for comparison. Creating a performance metrics database allows for regular collection of a defined set of performance measures for comparative analysis. Additionally, the historical data may be used for analyzing trending patterns of specific metrics, providing the ability to forecast future requirements.
Implementation
In database departments large and small, the collection, storage, and analysis of performance measures is required in order to proactively manage the database systems. Enterprise-scale commercial products to collect database performance statistics are widely available, providing the ability to create multi-color trending charts, forecasts, and real-time performance statistics displayed with multi-color animation. If your department's budget, your pride, or your disinterest in administering these tools has prevented their adoption, then your alternative is to create your own monitoring tool. Personally, I find myself driven to create my own tools; driven by an engineer's basic desire, that is too often subjugated by one-size-fits-all convenience.
In the Scripts section below, the individual scripts for querying the respective DMVs are provided to allow the reader to create his own custom performance monitoring solution. The solution might include a database into which to store the collected metrics, a set of stored procedures to access the data, and a job to run the collection queries periodically.
Scripts
--Returns the buffer cache hit ratio
SELECT
ROUND(CAST (A.cntr_value1 AS NUMERIC) / CAST (B.cntr_value2 AS NUMERIC), 3) AS Buffer_Cache_Hit_Ratio
FROM
(
SELECT cntr_value AS cntr_value1
FROM sys.dm_os_performance_counters
WHERE object_name = 'MSSQL$URINSTANCENAME:Buffer Manager'
AND counter_name = 'Buffer cache hit ratio'
) AS A
,
(
SELECT cntr_value AS cntr_value2
FROM sys.dm_os_performance_counters
WHERE object_name = 'MSSQL$URINSTANCENAME:Buffer Manager'
AND counter_name = 'Buffer cache hit ratio base'
) AS B
--Returns the page life expectancy in minutes
SELECT round ( (CAST (cntr_value AS NUMERIC) / 60), 1) AS 'Page Life Expectancy in Minutes'
FROM sys.dm_os_performance_counters
WHERE object_name = 'MSSQL$URINSTANCENAME:Buffer Manager'
AND counter_name = 'Page life expectancy'
--Returns pages read per second
SELECT cntr_value AS 'Page reads per Second'
FROM sys.dm_os_performance_counters
WHERE object_name = 'MSSQL$URINSTANCENAME:Buffer Manager'
AND counter_name = 'Page reads/sec'
--Returns pages written per second
SELECT cntr_value AS 'Page writes per Second'
FROM sys.dm_os_performance_counters
WHERE object_name = 'MSSQL$URINSTANCENAME:Buffer Manager'
AND counter_name = 'Page writes/sec'
--Returns Free list Stall per second
SELECT cntr_value AS 'Free List Stalls per second'
FROM sys.dm_os_performance_counters
WHERE object_name = 'MSSQL$URINSTANCENAME:Buffer Manager'
AND counter_name = 'Free list stalls/sec'
--Returns Lazy writes per second
SELECT cntr_value AS 'Lazy writes per second'
FROM sys.dm_os_performance_counters
WHERE object_name = 'MSSQL$URINSTANCENAME:Buffer Manager'
AND counter_name = 'Lazy writes/sec'
--Returns Total SQL Server Memory
SELECT cntr_value AS 'Total SQL Server Memory'
FROM sys.dm_os_performance_counters
WHERE object_name = 'MSSQL$URINSTANCENAME:Memory Manager'
and counter_name = 'Total Server Memory (KB)'
--Average Latch Wait Time
SELECT
ROUND(CAST (A.cntr_value1 AS NUMERIC) / CAST (B.cntr_value2 AS NUMERIC), 3) AS [Average Latch Wait Time]
FROM
(
SELECT cntr_value AS cntr_value1
FROM sys.dm_os_performance_counters
WHERE object_name = 'MSSQL$URINSTANCENAME:Latches'
and counter_name = 'Average Latch Wait Time (ms)'
) AS A
,
(
SELECT cntr_value AS cntr_value2
FROM sys.dm_os_performance_counters
WHERE object_name = 'MSSQL$URINSTANCENAME:Latches'
AND counter_name = 'Average Latch Wait Time Base'
) AS B
-- Returns Pending memory grants
SELECT cntr_value AS 'Pending memory grants'
FROM sys.dm_os_performance_counters
WHERE object_name = 'MSSQL$URINSTANCENAME:Resource Pool Stats'
and counter_name = 'Pending memory grants count'
-- Returns Pending Disk IO Count
SELECT [pending_disk_io_count] AS [Pending Disk IO Count]
FROM sys.dm_os_schedulers
-- Returns the number of user connections
SELECT cntr_value AS [User Connections]
FROM sys.dm_os_performance_counters
WHERE object_name = 'MSSQL$URINSTANCENAME:General Statistics'
and counter_name = 'User Connections'
--Returns CPU Utilization Percentage
SELECT
(ROUND(CAST (A.cntr_value1 AS NUMERIC) / CAST (B.cntr_value2 AS NUMERIC), 3))*100 AS [CPU Utilization Percentage]
FROM
(
SELECT cntr_value AS cntr_value1
FROM sys.dm_os_performance_counters
WHERE object_name = 'MSSQL$URINSTANCENAME:Resource Pool Stats'
and counter_name = 'CPU usage %'
) AS A
,
(
SELECT cntr_value AS cntr_value2
FROM sys.dm_os_performance_counters
WHERE object_name = 'MSSQL$URINSTANCENAME:Resource Pool Stats'
and counter_name = 'CPU usage % base'
) AS B
--Returns Data File Size
SELECT instance_name AS 'DB Name',cntr_value AS 'Data File Size'
FROM sys.dm_os_performance_counters
WHERE object_name = 'MSSQL$URINSTANCENAME:Databases'
and counter_name = 'Data File(s) Size (KB)'
--Remaining Log File KB
SELECT A.instance_name as 'DB',
CAST (Size AS NUMERIC) - CAST (Used AS NUMERIC) AS [Available Log File KB]
From
(SELECT instance_name ,cntr_value AS Size
FROM sys.dm_os_performance_counters
WHERE object_name = 'MSSQL$URINSTANCENAME:Databases'
and counter_name = 'Log File(s) Size (KB)') AS A
inner join
(SELECT instance_name ,cntr_value AS Used
FROM sys.dm_os_performance_counters
WHERE object_name = 'MSSQL$URINSTANCENAME:Databases'
and counter_name = 'Log File(s) Used Size (KB)') AS B
on A.instance_name = B.instance_name
-- Returns percent Log File Used
SELECT instance_name as 'DB', cntr_value as 'Percent Log Used'
FROM sys.dm_os_performance_counters
WHERE counter_name = 'Percent Log Used'
--Returns Transactions per second
SELECT instance_name AS 'DB Name', cntr_value AS 'Transactions per second'
FROM sys.dm_os_performance_counters
WHERE object_name = 'MSSQL$URINSTANCENAME:Databases'
and counter_name = 'Transactions/sec'
Assuming that you are collecting the performance metrics using a SSA job, then I suggest that the frequency of the job be set to 60 seconds during operational hours. A frequency of 60 seconds will provide you, the DBA, with sufficient performance data to ensure that the instance is operating optimally. Obviously, a frequency of 60 seconds may not be optimal for every situation for your particular implementation, you may decide to increase or decrease the frequency. Understanding the consequence of altering the frequency of metrics collection is important: 1) Decreasing the frequency creates more data and requires more I/O from the instance; conversely, 2) Increasing the frequency may reduce the amount of data and I/O, but may also allow an issue to become a problem.
In my paper, SQL Server Instance Health Monitoring Tool, I discuss a method for using the collected metrics to create a performance repository and SSRS report, for graphical representation of an instance's performance (Figure 1). If your monitoring responsibilities include a small number of instances, then the graphical representation may be useful to you and your manager. However, I currently use the tool to monitor over 50 geographically distributed instances, rendering the review of a graphical representation for each instance unwieldy at best.
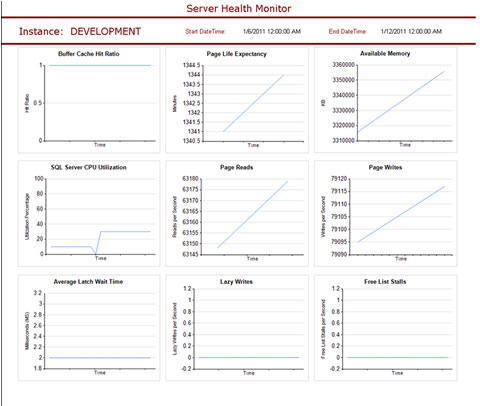
Figure 1 Server Health Monitor
My approach to monitoring this large number of instances depends on a scheduled job that uses a sliding window sampling of each metric. It alerts me only if the value of the metric falls below the configurable threshold. I use a SSIS job to retrieve the metrics data into a centralized repository, maintaining only 5 minutes (configurable duration) of data locally on each monitored instance. The repository maintains the metrics data for 30 days, after which the data is archived; archiving the data allows me to use the historical performance for testing following an upgrade, patch, etc.
Summary
Proactive database management requires the collection and analysis of performance information. A plethora of commercial monitoring tools provide a one-size-fits-all approach, while SQL Server and Windows provide built-in tools, Profiler and PerfMon respectively, that allow the collection of performance data. This paper introduced another approach, using the rich set of Dynamic Management Views provided in SQL Server since version 9.x. Using the DMVs discussed, a DBA has the ability to monitor the performance of SQL Server in real-time, while also having the ability to store the collected data for comparative analysis at a future time. Best of all, these capabilities are provided "free of charge" allowing the monitoring tool budget to be reallocated to educational (boondoggle) conference attendance.
