

One of the most common questions when you consider using Azure SQLDatabase is related to the choice of the service tier needed.The service tier is measured in DTU(Database Transaction Units), which can be determined by measuring the resource utilization (CPU, memory and I/O) on your on-premises server. This article will help to determine the number of DTUs and to decide the service tier you need for an Azure SQL Database based on the workload for your on-premises SQL Server.
For that you will need to capture several performance metrics on your SQL Server using Perfmon utility. To provide the most accurate measurement, you should run a representative production workload during a time period that captures the expected range of usage. Measure the following utilization metrics for at least an hour so the calculator can analyze utilization over time to provide you the best recommendation.
Capturing Performance Metrics Using Perfmon
Open Performance Monitor by using Windows key + R keyboard shortcut to open the Run command. Then type perfmon and click OK to open to utility.
When you first open the tool, it will open in the main page with a brief overview, as well as a system summary with real-time data about memory, network adapter, physical disk, and processor usage. On the left, you will find the navigation pane with access to Performance Monitor, Data Collector Sets, and Reports. Expand Data Collector Sets.
Right-click "User Defined", select New, and click on Data Collector Set as shown in Image:1. Type a descriptive name for the new set. Select the create from a template (Recommended) option. Click Next.
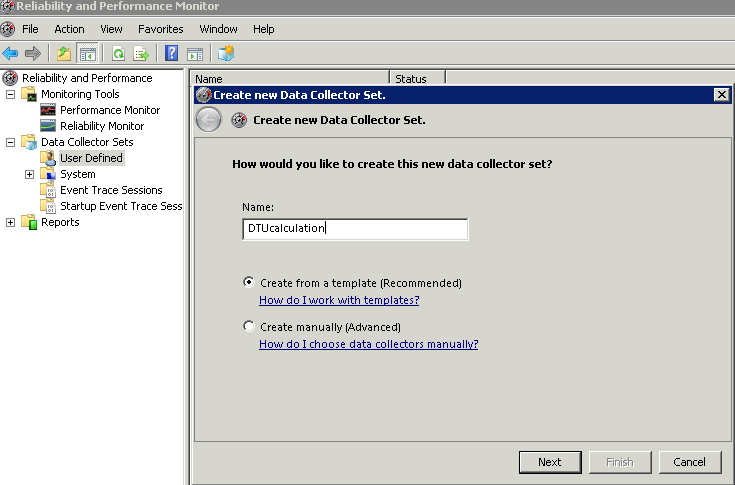
Image 1
Select Create data logs and check the Performance counter option. Click Next. (as shown in Image 2).
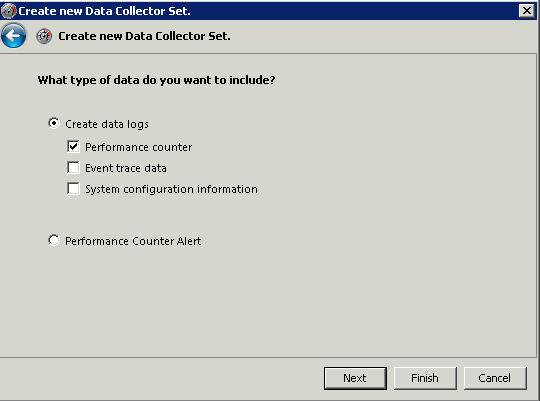
Image 2
Manually add the following performance counters from the available counters to get the total value for the selected object as shown in Image:3 and 4.
- Processor - % Processor Time
- Logical Disk - Disk Reads/sec
- Logical Disk - Disk Writes/sec
- Database - Log Bytes Flushed/sec
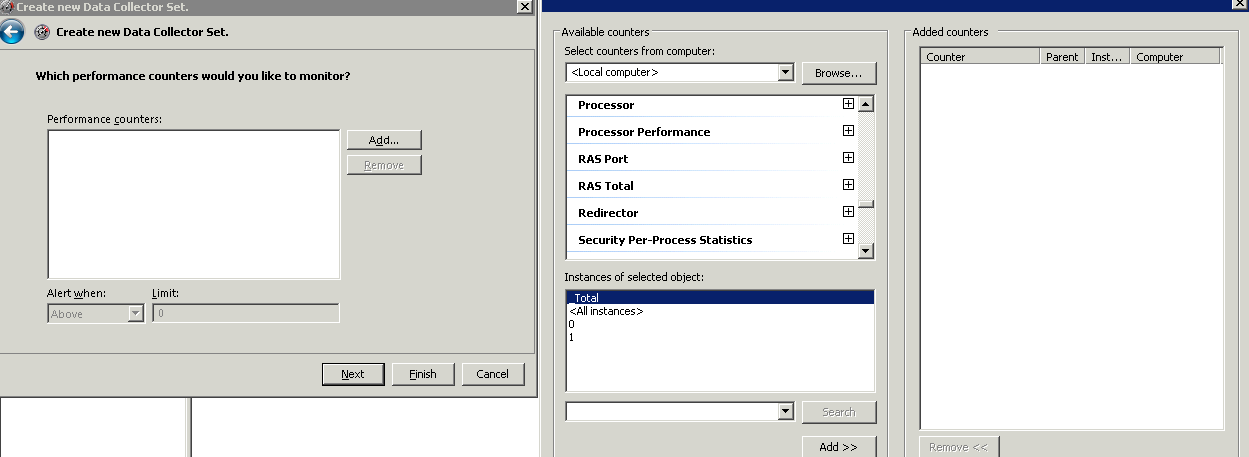
Image 3
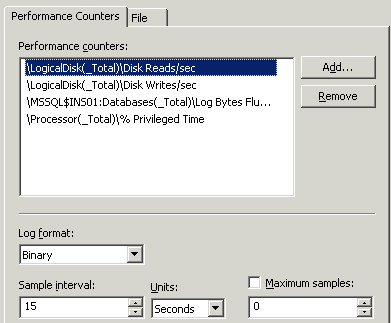
Image 4
Once the performance counters are selected, check the “Save and Close option”. Click "Finish" to create the user defined data collector set with name, “DTUcalculation”.
After completing the above steps, you can right-click your Data Collector Set under "User Defined," and click Start to run it or Stop to shut it down. You can customize the custom Data collector set to stop automatically after a period of time, or run it on schedule, you'll need to manually configure those options.
To allow a set to stop automatically after a period of time, do the following:
- Right-click the Data Collector Set and select Properties.
- Click on the Stop Condition tab.
- Check the Overall duration option.
- Define the time duration (e.g., 60 minutes).
- Configure the limits as needed.
- Click Apply.
- Click OK.
The performance counters are captured in the .blg format. Note that the Microsoft DTU Calculator requires a CSV file. Now, convert the .blg to a .csv format using below steps:
- Open a command prompt (Start–>Run–>Type cmd–>Enter) or from Tiles just type cmd and press enter.
- Use “cd” to change directory to the directory containing your .blg file
- Now type relog NameOfYourFile.blg -f CSV -o NewNameOfFile.csv
- This command will not change the old file; it will create a new file in the csv format.
- Open Excel and import the new .csv file.
On the site http://dtucalculator.azurewebsites.net/ , enter the number of cores and upload the CSV file as shown in image 5. Click the Calculate button to view your recommended Service Tier/Performance Level and DTUs. After clicking the Calculate button, you'll see several charts which provide an analysis of your database resource consumption(as shown in Image:6).
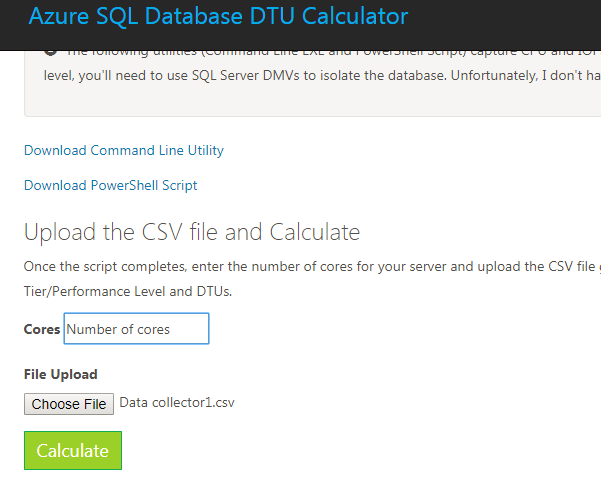
Image 5
The Service Tier/Performance Level chart(Shown in Image:6) represents the frequency of time your database workload falls into the indicated service tier and performance level. The above example suggests, the Standard S4 service tier can meet performance requirements of the current on-premises instance in Azure, because the Standard Service tier covers 91.77% of our workload utilization.
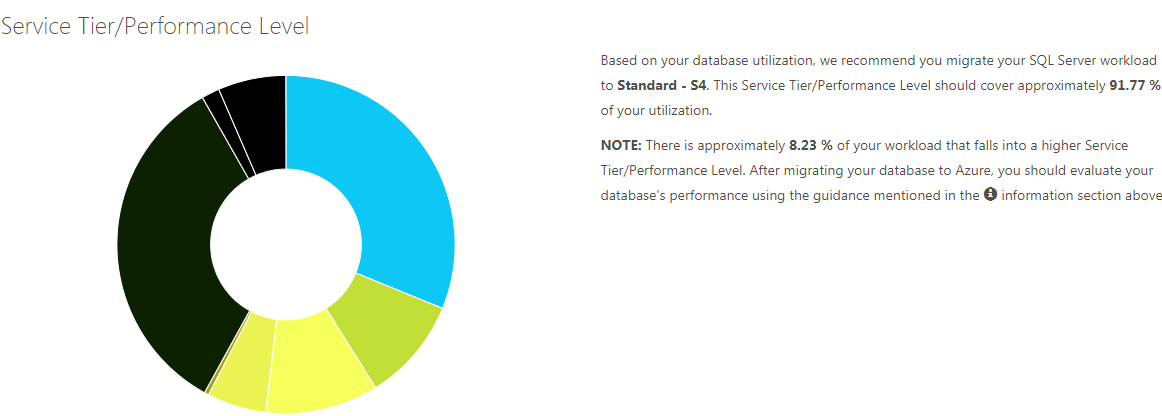
Image 6
The DTU’s Over Time chart illustrates the DTU requirement in the duration of your monitoring period. For DTU’s Over Time chart, we can decide on a bit higher than average value for the DTUs. The above chart in Image:7 shows that the value can be 200 DTUs.
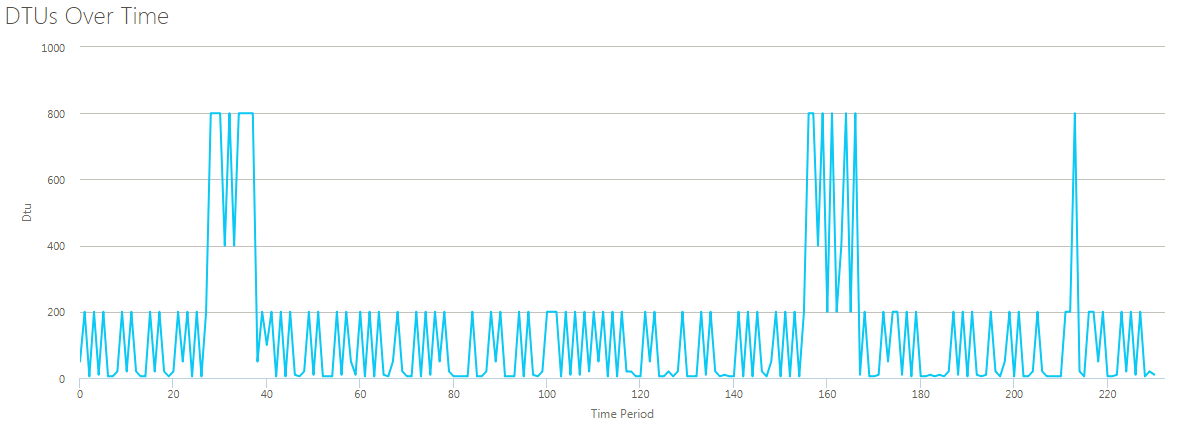
Image 7
The last chart illustrates how much of your workload’s CPU, IOPS, and Log is covered by a Service Tier/Performance Level.
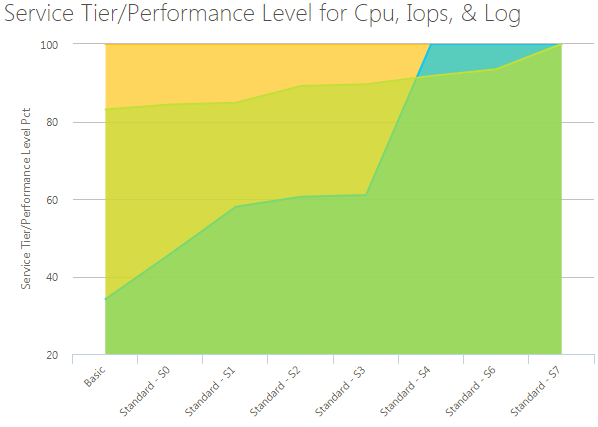
Image 8
Summary
Azure service models are split into DTU-based and vCore-based.The DTU-based model has the Basic, Standard and Premium tiers.The Basic, Standard and Premium tiers in the DTU model each have limitations, and these can affect which combination of model, tier and level is chosen for your workload. A decision matrix is provided to help make those decisions.


