

Introduction
Dynamic Management views and functions are a new add on feature in SQL Server 2005.In previous versions, to find out the real time statistics the user had to issue DBCC commands or run profiler.SQL Server 2005 is shipped with Dynamic management views to ease the troubleshooting process.DMVs and functions have replaced many system tables and system stored procedures. The information returned by DMVs and functions represents the internal state data of the server. It gives us information about the health of that instance, helps us in diagnosing problems and tuning the server accordingly.
DMVs and functions can have server or database scope. The DMVs can be addressed using two, three or four part names.DM functions can be addressed using two or three part names. Both can be addressed using one part names. The DMVs and functions exist in the sys schema. So when using the DMVs and functions, they must be prefixed with sys.
There are around 70 DMVs and functions. Some examples of DMVs and functions are as follows:
Database Related DMVs and functions
Sys.dm_db_file_space_usage : This gives information about the file space usage for each file in the tempdb database. Some of the columns returned by this view are:
- Database ID
- File ID
- Unallocated_extent_page_count - This gives information total number of pages in the unallocated extents
- User_object_reserved_page_count - Information about the total number of pages allocated from uniform extents for user objects. The user objects can be:
1. User defined tables and indexes
2. System tables and indexes
3. Global and local temporary tables
4. Table variables
- Internal_object_reserved_page_count - This gives the total number of pages allocated from uniform extents to the internal objects. The internal objects are applicable only to tempdb database. These objects can be temporary tables used for cursor operations, work files used for hash joins and the temporary tables used for sort operations.
The sys.dm_db_file_space_usage can used to troubleshoot insufficient disk space in tempdb.To find the number of unallocated pages in kb,we can use the sys.dm_db_file_space_usage DMV as follows:
   SELECT SUM(unallocated_extent_page_count) AS [free pages],
         (SUM(unallocated_extent_page_count)*8) AS [free space in KB]
    FROM sys.dm_db_file_space_usage
In the similar way one can find out the space used by internal objects and user objects.If there are lots of temporary tables used,it affects the performance.So the user can keep a check on the temporary tables created by using sys.dm_db_file_space_usage DMV.
Execution related DMVs and functions
Sys.dm_exec_sessions - This returns one row per authenticated session established with the SQL Server. Some of the columns returned by dm_exec_sessions are:-
- Session_ID
- Login time
- Host_name - Host name associated with the session.
- Program_name - Program name associated with the session
- Login_Name - SQL Login Name of the user of the session
- Status: - Status of the session. Can be running, sleeping or Dormant
- Memory_Usage - Memory usage by each session.
- Transaction_Isolation_level - Isolation level of the transactions in that session. It can be anything from 0 to 5. 0 = Unspecified, 1 = ReadUncomitted, 2 = ReadCommitted, 3 = Repeatable, 4 = Serializable, 5 = Snapshot
Example: To determine the number of sessions established by every login:
select
   login_name
 , count(session_id) as session_count
 from sys.dm_exec_sessions
 group by login_name
Sys.dm_exec_cursors - Returns the cursors that are open in the databases.
Example:
SELECT * FROM sys.dm_exec_cursors(0)
The parameter that is supplied to this DMV is the session id.If 0 is specified, it means the open cursors in all sessions.
Sys.dm_exec_connections - Returns information about the connections made to the instance of the SQL Server and the details of each connection.
Example:
select a.session_id
     , b.login_name
  FROM sys.dm_exec_connections a ,sys.dm_exec_sessions b
  WHERE a.session_id=b.session_id
The above query gives the connections established by the user along with the session details and login name.
Sys.dm_exec_cache_plans - Returns the query plans which are cached by the SQL Server. The SQL Server caches the execution plans for faster processing of queries. With the help of this DMV,the user can know the memory occupied by the cache objects,the type of the object in the cache,count of the number of cache objects accessing this cache object,the number of times the cache object has been used.
Example:
select * from sys.dm_exec_cached_plans
Some of the columns returned by this query are:
- BucketID: The ID of the hash bucket in which the plan is cached.
- Refcounts: Number of cache objects accessing this cache object
- Usecounts: Number of times this object has been used.
- Size_in_bytes: The memory occupied by the cache object in bytes.
Index Related DMVs and Functions
sys.dm_db_index_physical_stats - This dynamic management function returns the size and fragmentation information of the index of a specified table or view.It replaces the DBCC SHOWCONTIG statement.
Syntax:
sys.dm_db_index_physical_stats (
    {database_id | NULL | 0 | DEFAULT}
    , {object_id | NULL | 0 | DEFAULT}
    , {index_id | NULL | 0 | -1 | DEFAULT}
    , {partition_number | NULL | 0 | DEFAULT}
    , {mode | NULL | DEFAULT}
)
Arguments:
Database_ID: The ID of the database. If NULL | 0 | DEFAULT is specified, then it considers all the databases in that instance.
Object_ID: Object ID of the table or view to which the index belongs to.
Index_ID: ID of the index.
Partition_Number: Partition number in the object
Mode: Specifies the scan level. It can be DETAILED, SAMPLED, LIMITED, NULL or DEFAULT. LIMITED is the fastest. It scans only the parent level pages of an index and not the leaf level pages. The SAMPLED mode returns statistics based on a 1 percent sample of all the pages in the index or heap. If the index or heap has fewer than 10,000 pages, DETAILED mode is used instead of SAMPLED. The DETAILED mode scans all pages and returns all statistics.
Example: To find the information about all the databases in the instance of that SQL Server:
select *
 from sys.dm_db_index_physical_stats(NULL,NULL,NULL,NULL,NULL)
Sys.dm_db_index_physical_stats helps in detecting the fragmentation percentage of the index. The avg_fragmentation_in_percent column returned by Sys.dm_db_index_physical_stats determines the fragmentation level of the index. It should be close to zero for maximum performance.The acceptable limits are between 0 and 10%.If the fragmentation percentage is less than 30%,consider reorganizing the index.If it is grater than 30%,rebuild the index. For example:
select object_id
     , index_id
  , avg_fragmentation_in_percent
  from sys.dm_db_index_physical_stats(db_id(),object_id('dbo.databaselog'),NULL,NULL,NULL)
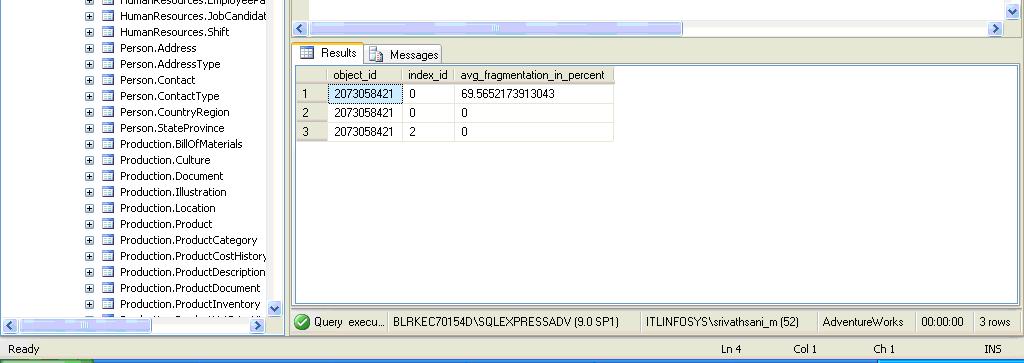
Now here the avg_fragmentation_in_percent is higher than 30% for index_id 0.So we need to rebuild the index.
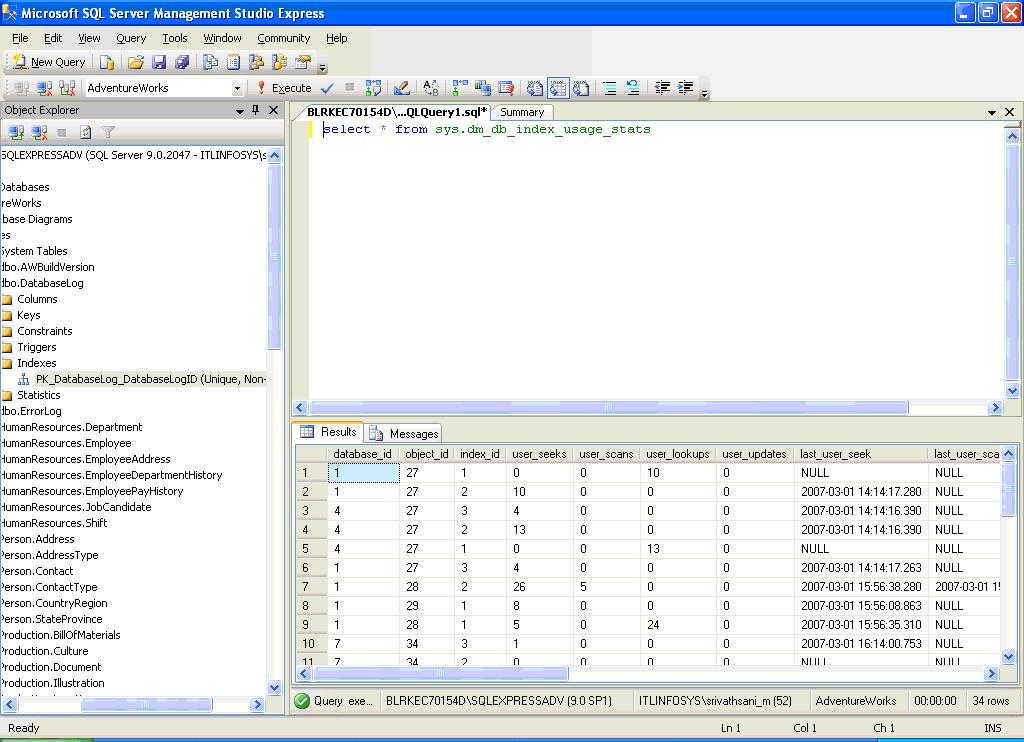
Sys.dm_db_index_usage_stats - It returns the number of counts of the different operations like seeks, scans, lookups, user updates etc. and the timings each type of operation was last performed.
Operating System Related DMVs and functions
Sys.dm_os_memory_objects : Returns the memory objects that are currently allocated by SQL Server.
Sys.dm_os_performance_counters : This DMV makes it possible to query a view directly to capture the SQL Server counters related to the instance.Some of the counters associated with SQL Server are:
MSSQL:Locks
MSSQL:Databases
MSSQL:Broker Statistics
MSSQL:Transactions
MSSQL:Memory Manager
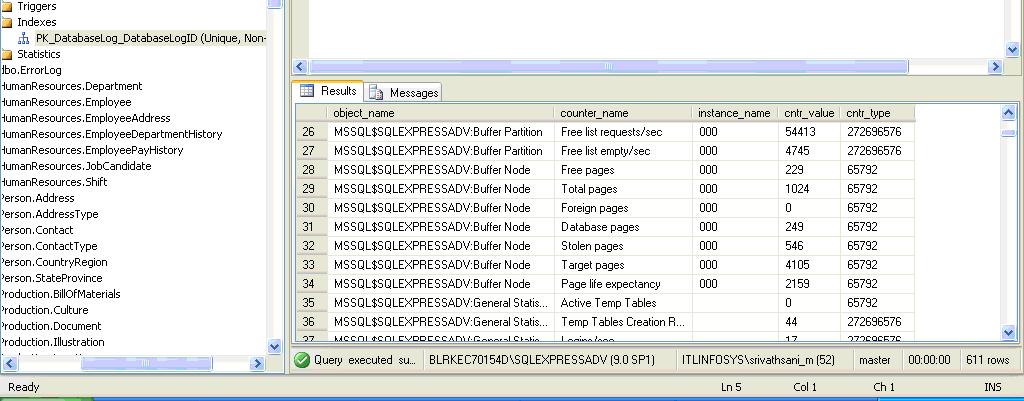
This DMV can be used to obtain one SQL Server counters.For counters related to memory, physical disk the user has to run the performance monitor.
Sys.dm_os_wait_stats : This gives information about the threads that waiting for resources in milliseconds. With the help of this information the user can tune the applications for more concurrency and better performance. This DMV can be used instead of DBCC SQLPERF('WAITSTATS').
select * from sys.dm_os_wait_stats
The columns returned by this DMV are:
- Wait_type - Name of the wait type
- Waiting_tasks_count - The number of waiting threads of this wait type.
- Wait_time_ms - Total time in milliseconds including the signal_wait_time
- Max_wait_time_ms - Maximum wait time for this wait type
- Signal_wait_time - Difference between the time the waiting thread was signaled and when it started running in milliseconds
The threads can wait for a resource. Suppose the thread requests to access a resource which is being used by another thread, then the thread has to wait. The waits can also be due to external events such as the SQL Server thread is waiting for an extended stored procedure or linked server query to finish.
This DMV captures around 100+ wait types. They include backup, latches and locks, page latches, Distributed Transactions, Checkpoints etc.
Sys.dm_os_sys_info : Returns information about the computer and the resources available and consumed by the SQL Server. Some of the columns returned are:
- CPU_count - Number of logical CPUs
- Physical_memory_in_bytes
- Virtual_memory_in_bytes
- OS_Error_mode - The error mode for SQL Server processes
- OS_priority_class - The priority class for SQL Server processes
Transaction Related DMVs and Functions
Sys.dm_tran_active_transactions : Returns information about the transactions in a SQL Server instance.Some of the columns returned are:
- Transaction_ID
- Name
- Transaction_begin_time
- Transaction_type - It can be a read-only (2), read/write (1), system (3) or a distributed transaction (4)
Sys.dm_tran_current_transaction : Returns a single row which gives information about the current transaction in the current session. Some of the columns returned are:
- Transaction_ID
- Transaction_is_Snapshot - The value is 1 if transaction is started under snapshot isolation level, else 0.
Sys.dm_tran_database_transactions : Returns information about the transactions in that database.
Conclusion
Thus the user can make use of this powerful feature to capture real time metrics. For a complete listing of DMVs and Functions, the user can refer to SQL Server 2005 Books Online.

