

Introduction
It's not uncommon that a few months after a new project is released, the database performance degrades. Several things could be responsible for this degradation, but the one I’ve seen more often is data and structure related. In these cases, I noticed that the database was not designed with any consideration for the volume of data it will have, so the structure of the database (columns, indexes) and the queries became a problem. Of course, adding more and more data to the database, increasing the quantity of users accessing it and having poor performing queries can increase the possibility of a deadlock’s occurrence.
For those not familiar with deadlocks, here is a brief explanation of what it is. A deadlock occurs when, for instance, two processes are blocking each other. For instance, User1 begins a transaction and updates TableA. At the same time, User2 begins a transaction and updates TableB. Next, User1 performs a Select on TableB and User2 performs a Select on TableA. In this simple example, User1 gets blocked by User2 because the update on TableB was not yet committed. Also, User2 gets blocked by User1 because TableA update was not committed. When things like this happen, a deadlock occurs, so SQL needs to choose which process to rollback, letting the other one to complete.
There are several ways to solve deadlocking, but that's not the topic I'll cover here. I'll show a simple way to get the needed information to address the problems.
Analysis
Some time ago I faced a deadlock issue in one of the production databases. It was kind of strange as there were no structural changes to the database or queries changed, and the number of users and applications accessing it didn’t change either. The only difference was more data stored in the database as one legacy system was incorporated into this database. In order to analyze the deadlock errors, I enabled the 1222 trace flag on the server to capture the deadlocks on the error log.
DBCC TRACEON (1222, -1)
Now all deadlock information was getting captured into the error log, but of course there was another problem, which was the order of the information. With this I mean that in the error log I was seeing entries ordered not on the deadlock-sequence way but on the occurrence date. I needed to sort that information into a more readable way.
To do so, the following code gets the deadlock information from the error log and presents it in a more readable way:
declare @RawLogs table (id int IDENTITY (1, 1), logdate datetime, processinfo nvarchar(50), logtext nvarchar(max))
insert into @RawLogs
exec sp_readerrorlog
declare @results table (id int IDENTITY (1,1), logdate datetime, processinfo nvarchar(50), logtext nvarchar(max))
declare @ids table (id int, processinfo nvarchar(50))
insert into @ids
select id, processinfo
from @RawLogs
where logteXt = 'deadlock-list'
order by id
declare @Startid int, @endid int, @processinfo nvarchar(50)
select top 1 @Startid = id from @ids order by id
while(@@rowcount<>0)
begin
select @processinfo = processinfo from @ids where id = @Startid
select top 1 @endid = id from @ids where id > @Startid and processinfo = @processinfo order by id
insert into @results (logdate, processinfo, logtext)
select logdate, processinfo, logtext
from @RawLogs
where
   id >=@Startid and
   processinfo = @processinfo and
   id < @endid
order by id
delete @ids where id = @Startid
select top 1 @Startid = id from @ids order by id
end
select logdate, processinfo, logtext
from @results
order by id
The result of the above query gives something similar to this:
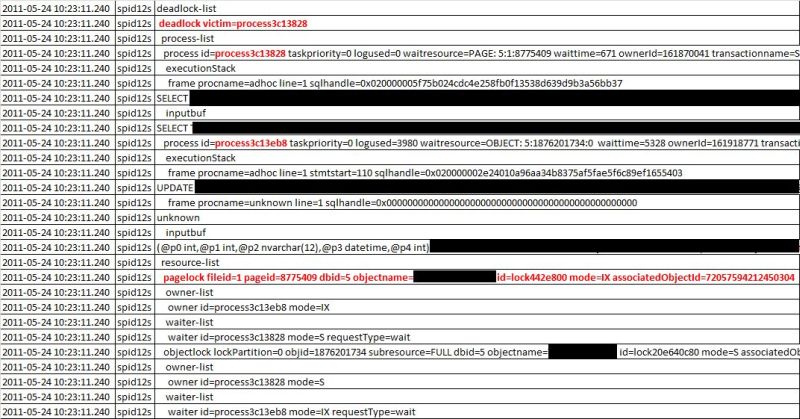
From the results, I highlighted certain things than can help identifying the deadlock occurred. The first thing is the ID of the deadlock victim, which is the process that was rolled back. If you look for that ID on the following rows, you'll see (in this case) that the SELECT statement was the cancelled one, and the UPDATE process was the one that completed.
You can see also relevant information regarding the database ID, the object IDs, etc. that can help identify the root cause and all the "players" involved.
Conclusion
Although enabling this on a production server for a long time is not the best option, it can definitely help identifying deadlocks on-the-fly without configuring a profiler or a trace and have that info stored on the server's logs. The intended purpose of this is having an easy way to catch those deadlocks and read that info from the logs.

