

This article shows how you can create a dynamic report in SQL Server Reporting Services (SSRS). When you run this type of report normally, without selecting any particular grouping, you get a simple table. For example, Figure 1 shows a report with a table that contains information about films. Because the data is not being grouped, the information is very straightforward.
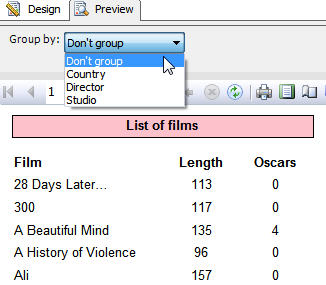
Figure 1: Displaying a table without grouping the information
In the figure above, the user can specifically choose not to group data. However, the user can also choose to group the data by one of the listed values, in which case we would expect to see very different results, as shown in Figure 2.
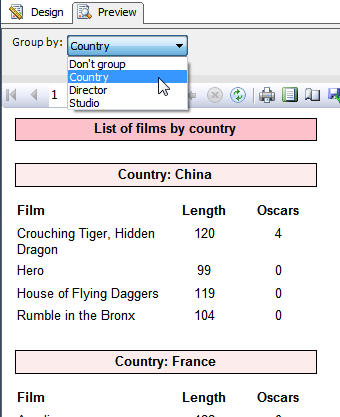
Figure 2: Grouping the data by country
As you can see, you can group the report data by a specific field. In this case, I’ve selected Country, which means the report will display the film information grouped by specific countries, which are the values contained in the Country field.
As basic as this might seem, there’s a lot to do to get this all working! So let’s look at how to do that. For now, we’ll ignore the Don’t group option and assume that we have to group by some field. When we get this working, we’ll then allow users to choose not to group the data.
Step 1 – Creating the Dataset
The report’s dataset must include the fields that we want to group by, along with any other fields whose data we want to include in the report. Figure 3 shows the dsFilms dataset, as it appears in the Report Data window. Notice that the dataset is expanded to show the list of fields that the dataset retrieves.
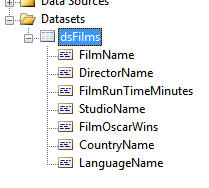
Figure 3: The fields in the dsFilms dataset
In this case, the dataset is retrieving data from the database shown in Figure 4. Notice that the fields in our dataset are checked in the tables within that database.
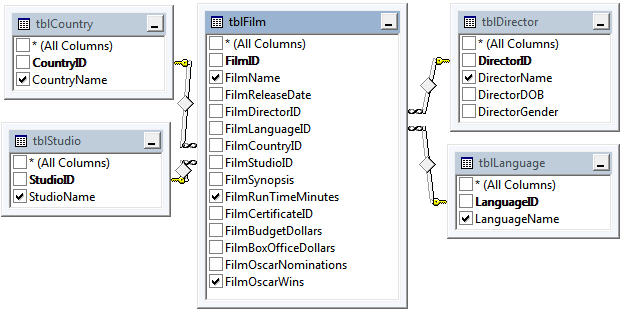
Figure 4: The database on which our dataset is based
As you can see, it’s a fairly simple database: each film is related to a country, film studio, director and language. (Now’s probably a good time to apologise to all American readers for calling them films, rather than movies!)
Step 2 – Creating the Table
Now we’ve got a dataset, we can create a simple grouped table. The easiest way to do this is to assume that we’re grouping by a fixed field. (We’ll assume we’re grouping by country.) Figure 5 shows what your grouped table should look like after you’ve added it to your design surface. Notice that I’ve added three fields from the dataset: FilmName, FilmRunTimeMinutes, and FilmOscarWins, renamed as shown in the figure.
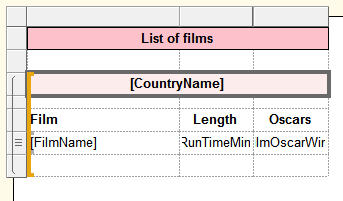
Figure 5: Adding a grouped table to our report
I also added a bit of formatting to make the report look a bit neater. When you view the report, it should look similar to what’s shown in Figure 6. As you can see, we have a basic report, grouped by country.
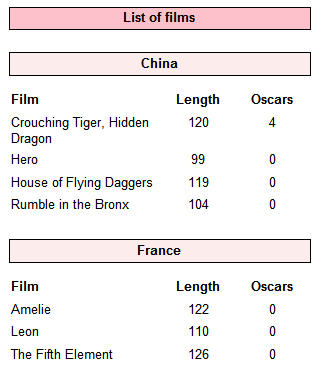
Figure 6: Viewing a report with the data grouped by country
So far, this is a fairly ordinary report. The next step is to add a drop-down list so viewers can choose how to group the data. This is what will make the report dynamic.
Step 3 – Creating the Parameter
To add a drop-down list to the report, you must start by adding a parameter. To do so, right click the Parameters node in the Report Data window, and then click Add Parameter, as shown in Figure 7.
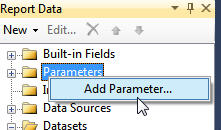
Figure 7: ?
When the Report Parameter Properties dialog box appears, provide a name for your parameter. I used GroupField, as shown in Figure 8.
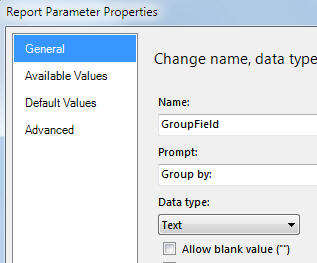
Figure 8: Providing a name for the report parameter
We can now list out the values available to our parameter. These values are the ones that will appear in our drop-down list.
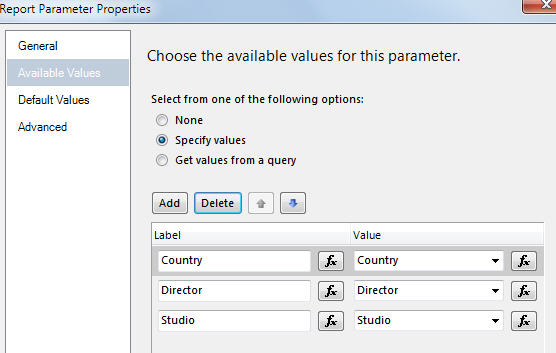
Figure 9: Adding values to your report parameter
It’s probably also worth making one of available values the default so that when users first run the report, they see something sensible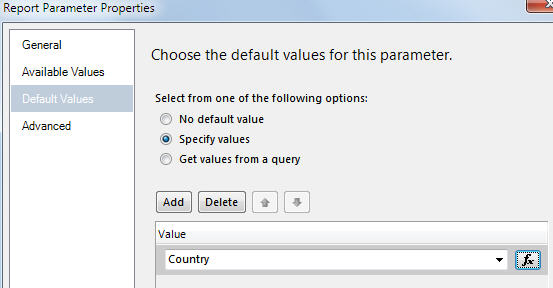
Figure 10: Specifying a default value for your report’s parameter
When you run the report, you should now see a drop-down list similar to the one shown in Figure 11.
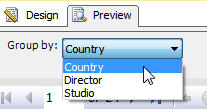
Figure 11: Viewing the drop-down list in your report
However, selecting an option from the drop-down list does not affect the data that’s displayed in your report—yet.
Step 4 – Making the Grouping Variable
This is the clever bit (and the reason you’re probably reading this article). We need to make the grouping dynamic. First edit the group’s properties. SSRS supports several ways to access the table’s group properties. One of the easiest ways is to right-click the group in the Row Groups window and then click Group Properties, as shown in Figure 12.
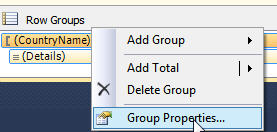
Figure 12: Accessing the table’s group properties
When you click this option, the Group Properties dialog box appears, as shown in Figure 13.
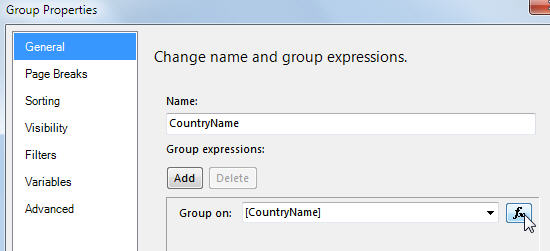
Figure 13: Viewing the CountryName group properties
What you should now do is change the name of the group. On my system, I changed the name from the specific CountryName to the more general GroupName, as shown in Figure 14.
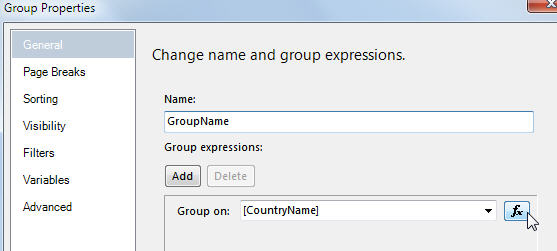
Figure 14: Changing the group name
Notice in the Group on text box shows the CountryName field as its value. That’s because the table’s group is based on this field. However, we’re going to instead define an expression. To create the expression, click the expression builder button next to the Group on text box. This opens the Expression dialog box, where you’ll modify the default expression to the one shown in Figure 15.
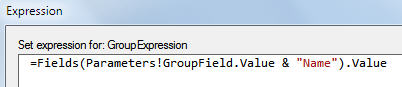
Figure 15: Modifying the expression association with the Group on text box
The expression tells SSRS to group the data based on the returned value. That value is based on the option selected from the drop-down list, concatenated with the word “Name.” We do this to return a value that matches the actual field name, as it’s listed in the dataset. For example, if the user selects Studio from the drop-down list, the expression will group the data based on the field called StudioName. This approach works because all of our group fields follow the same naming structure; if this were not the case, we’d have to use more complicated logic in our expression.
Step 5 - Tidying up the Report
Although the steps we’ve taken so far will get the grouping working, there are a number of other expressions we need to change to make the report tidier.
For example, report title shouldn’t be specific to the field selected from the drop-down list.
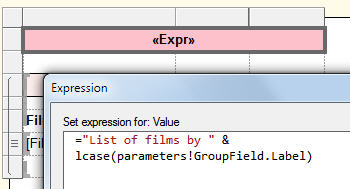
Figure 16:
So if, for example, a user chooses to group by Studio, the title will read List of films by Studio.
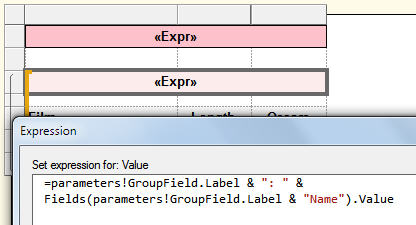
Figure 17:
This complicated expression will display something like Studio: MGM.
Finally, entries in the group should be sorted by the right field. (For example, if the user chooses to group by studio, then the group should be sorted by the value of the StudioName field.) To achieve this, return to the Group Properties dialog box and ???
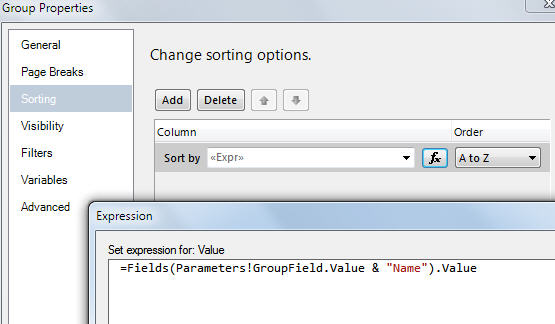
Figure 18: Sorting your grouped data
The expression tells SSRS to sort the data based on the returned field name. That name is based on the option selected from the drop-down list, concatenated with the word “Name.”
Step 6 – Making the Grouping Optional
I promised earlier that we would—eventually—make the grouping optional. Now is the time to do this! First, we’ll add another parameter value, as shown in Figure 19.
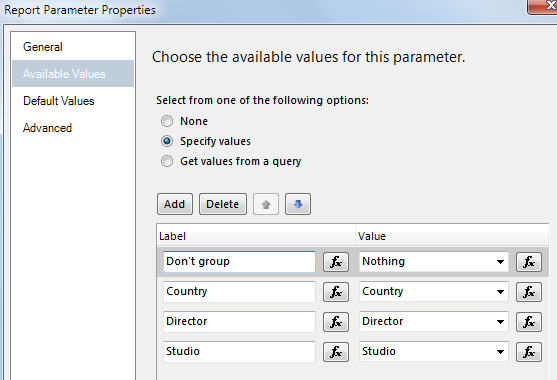
Figure 19: Adding another value to the report parameter
In this case, we’re adding a value whose label is Don’t group and value is Nothing. This change alone does nothing but add another value to our drop-down list, as shown in Figure 20.
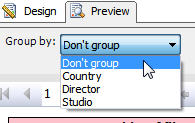
Figure 20: The new value as it appears in the drop-down list
We can’t remove grouping from the report, but what we can do is ensure that if the user chooses the Don’t group option, two things happen:
The grouping expression evaluates to a constant value so that all records belong to the same group.
The grouping header and footer are hidden.
Taken together, these two changes will make the report appear as if no data is being grouped. Let’s make those changes one at a time.
Step 7 – Group Expression Allowing for No Grouping
To set the grouping expression to accommodate a possible Don’t group choice, once again access the group properties. To do so, right-click the group in the Row Groups window, and then click Group Properties, as shown in Figure 21.
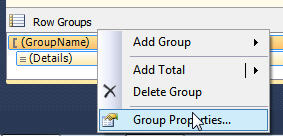
Figure 21: Accessing the tables group properties
When the Group Properties dialog box appears, click on the expression builder button to the right of the Group on text box, as shown in Figure 22.
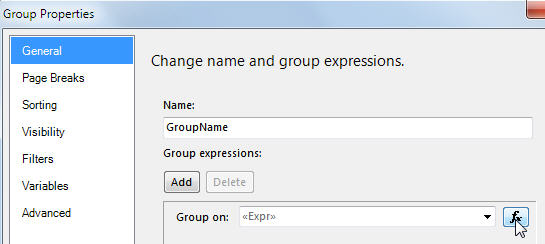
Figure 22: Accessing the expression associated with the Group on text box
In the Expression dialog box, modify the expression so to what is shown in Figure 23. (The expression is explained in more detail below.)
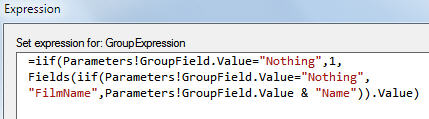
Figure 23: Modifying the expression associated with the Group on text box
The expression uses an IIF function in order to incorporate conditional logic. (The syntax is the same as the IF function in Excel: if the condition is true, do one thing; otherwise, do another.)
The first part of the function states that if the user has chosen not to group data (that is, if the GroupField parameter value is Nothing), then we set the value of the group expression to be an arbitrary constant value, in this case, 1. This way, all rows will belong to the same group.
If, on the other hand, the user has chosen to group data, we set the group expression to be as follows:
Fields(iif(Parameters!GroupField.Value="Nothing","FilmName",
Parameters!GroupField.Value & "Name")).Value
This represents the third argument in our initial IIF function. Notice that it includes another instance of the IIF function, which defines how to group the data if the user chooses a value other than Don’t group.
The reason this third argument is so cumbersome is because SSRS evaluates all parts of the expression, even if the first part of the IIF condition is true. This means that even if the user chooses Don’t group as an option, the last part of the expression will still be evaluated, and will crash the report because SSRS is trying to refer to a field that doesn’t exist. To avoid this happening, we specify the FilmName field, even though we know that this part of the expression can never be used!
While we’re at it, we also need to tidy up our titles. First, access the expression you defined on the report title and modify it as shown in Figure 24.
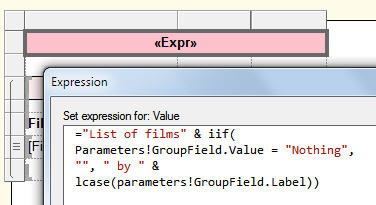
Figure 24: Modifying the expression used to define the title
As you can see, we’re again using the IIF function to add conditional logical to our expression. This way, the title is appended only if the user choses a field to group by.
Next, we need to modify the group title. Once again, access the expression you created for the group title and modify that expression as is shown in Figure 25.
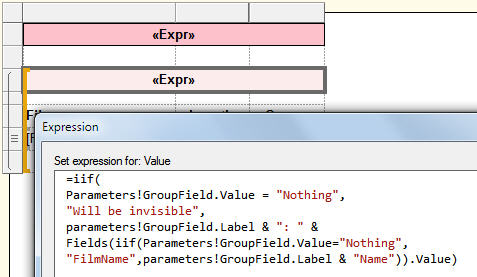
Figure 25: Modifying the expression used to define the group title
If the user doesn’t chose a grouping field, it doesn’t matter what we set this title to, as it will be hidden; otherwise, we set the title so that it reads something similar to Studio: MGM. (See the section above about the grouping expression for details about why this expression needs to be so complex.)
Step 8 – Hiding the Group Header Conditionally
Finally, we need to ensure the group header doesn’t appear when the user has chosen not to group. To do this, you have to change the properties of the group header rows.
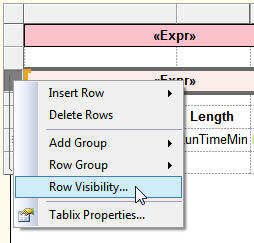
Figure 26: Accessing the Row Visibility dialog box
(Irritatingly, you have to do this one row at a time if you’re using the Properties dialog box). You can then set the row’s Hidden property to be an expression like this, as shown in Figure 27.
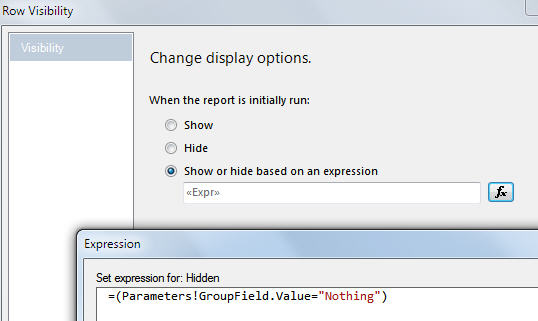
Figure 27: Creating an expression that defines a row’s visibility.
Thus if the user has chosen Don’t group as an option, the Hidden property will be set to True.
Hope people have enjoyed this article. If you like the idea of creating dynamic reports like this, you might like to look at an example of how to make the data source of a report dynamic, or a blog on making matrix dimensions dynamic.

