

The Unpopular SELECT Statement
Most of us are familiar with the SELECT statements to query a table but not many knows how to use SELECT statements to query a cube. Some of us have spent thousands of hours SELECT-ing data from tables but never done any SELECT on a cube, not even for a minute. So the purpose of this article to provide a hands-on experience querying a cube using MDX SELECT statements.
In the next 10 minutes we will:
1. Understand why it is important for us to know how to query a cube
2.Understand what a cube is
3.Create a cube by restoring from backup
4.Review the cube structure
5.SELECT the data from the cube
OK. Let’s start.
1. Why is it important for a SQL Server developer or DBA to understand how to query a cube using MDX?
Because more and more data is stored in cubes. We (SQL Server people) are lucky that Analysis Services is the most popular OLAP tool in the market with 31% market share in 2006, according to The OLAP Report. Analysis Services market share is growing every year. And with Analysis Services bundled up into SQL Server, a new world is open to us, providing us with opportunity to move across from the relational world to the OLAP world. MDX is the defacto standard language in the OLAP world, not only for Analysis Services, but also for Hyperion Essbase, another very popular OLAP tool.
Having OLAP skills could means better job opportunities. If you are a SQL Server DBA, and you are capable of administering both database server and OLAP server then you have the leisure of choosing the jobs that require either of those 2 skills, or both. If you are a SQL Server developer, here in the UK the job market for Analysis Services developers is smaller than SQL Server database developers and the average salary is higher, according to ITJobsWatch, a widely used web site for salaries of UK IT jobs. Analysis Services is £44k with 738 jobs in the last 3 months, compared to £39k for SQL Server developer with 1041 jos. How’s there in the US and Asia? Other countries? I welcome your comments in the discussion forum.
2. What is a cube?
As I explain in my book Building A Data Warehouse: With Examples in SQL Server, a cube is a form of database where the data is stored in cells and the position of each cell is defined by a number of hierarchical variables called dimensions. Each cell represent a business event, and the value of the dimensions shows when, where and how this event happened. Actually the term ‘cube’ is technically incorrect because mathematically a ‘cube’ is a 3D shape with 6 identical faces with each face being a square. The correct term is ‘Multidimensional Database’. But since ‘cube’ is easier to understand and widely used in the field (especially in Analysis Services), for the purpose of this article I’ll use the term ‘cube’.
Figure 1 shows a Sales cube for retail industry with 3 dimensions: product, date and store. Each cell in the cube represents the event of an item going through checkout. The position of each cell is defined by the value of the dimensions. Each cell contains 3 numbers: quantity, sales amount and sales cost.
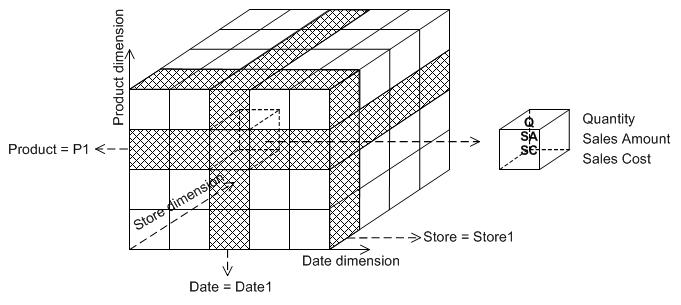
Figure 1. A sales cube with 3 dimensions
3. Create a cube by restoring from backup
One of the main reasons why we never done SELECT from a cube is because we don’t have a cube. There may be lots of tables around you but there is no single cube. So let’s create the cube shown in Figure 1.
Backup of an Analysis Services database: Sales.abf (see the download in the Resources section below) (176 KB)
Download the above backup file and follow these steps to restore the cube. For this exercise you need SQL Server 2005 (or SQL Server 2008 Nov CTP), with Analysis Services installed.
- Make sure that SQL Server Analysis Services is running. If not, start it in the SQL Server Configuration Manager.
- Open SQL Server Management Studio, connect to your Analysis Services instance.
- On the Object Explorer, expand the Analysis Services instance by clicking + to the left of it, right click the Databases folder and choose Restore... as shown in Figure 2.
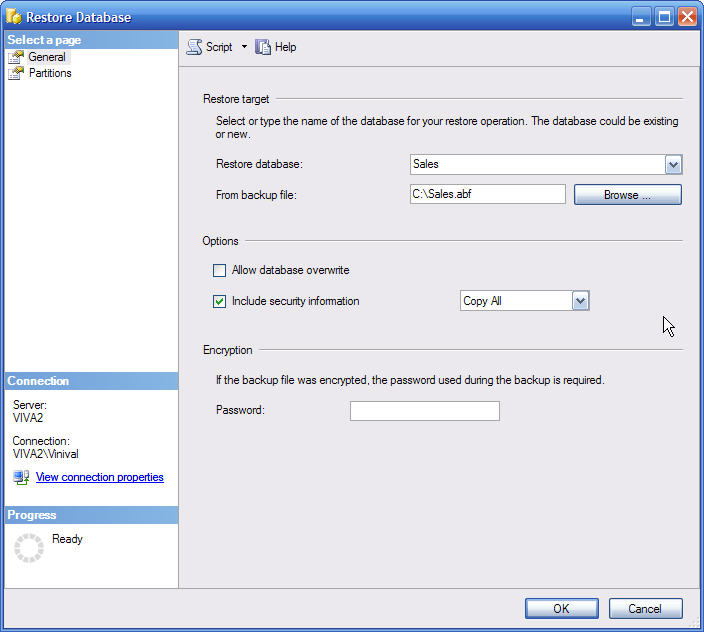
- On the Restore Database window, type Sales as the Restore database and click Browse... to select the Sales.abf that you downloaded as shown in Figure 3 and click on OK.

Figure 3. Restore Database window
- On the Object Explorer, right click on the Database folder again and click on Refresh. You will now see the Sales database that you just restored on the Object Explorer.
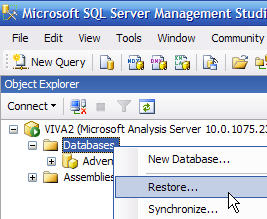
Figure 2. Restoring an Analysis Services database
4. Review The Cube Structure
Before we do the SELECT statement, let’s familiar ourselves with the Sales cube we have just restored. This is done by browsing the cube.
- Expand Analysis Services instance by clicking + sign, expand the Databases folder, expand the Sales database, expand the Cubes folder, right click on the Sales cube and choose Browse as shown in Figure 4.
- SSAS cube browser opens. Close Object Explorer pane and expand date, product and store dimension by clicking on their + sign. It looks like Figure 5 below.
- Let’s drag <Sales Amount> to Drop Totals or Detail Fields Here, drag Month to Drop Row Fields Here, drag Product Category to the Select dimension area and set it to "Book". The result is shown on Figure 6 below.
- We can see that the cube has 3 measures and 3 dimensions, and we know the attributes of those dimensions. Please feel free to explore the cube further by changing the dimension attributes on the row, column and filter areas to get yourself familiar with the cube.
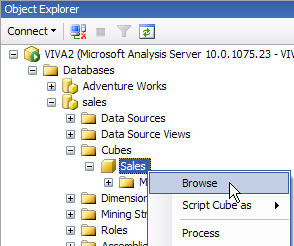
Figure 4. Opening the cube browser
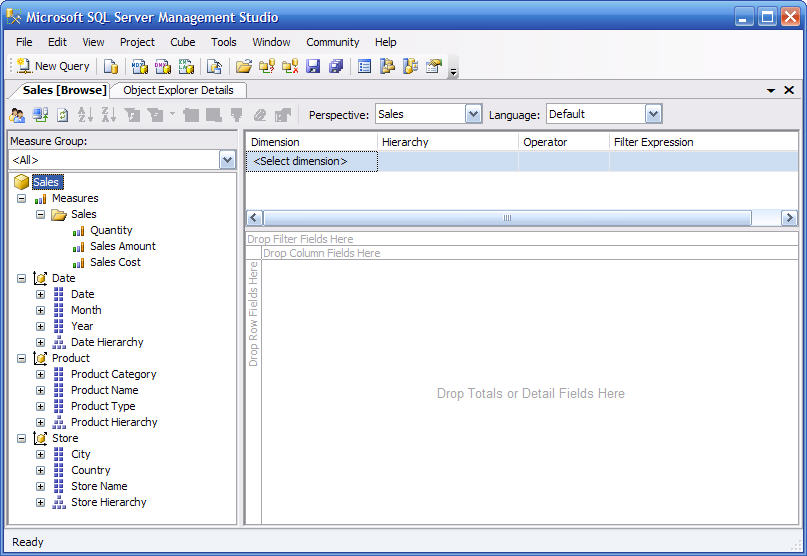
Figure 5. Browsing a cube
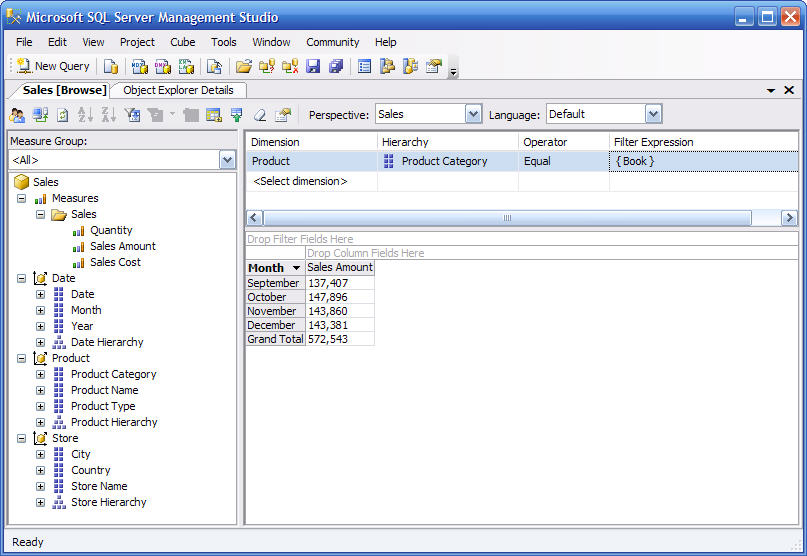
Figure 6. Monthly sales amount for Book products
5. SELECT The Data From The Cube
Now that we know cube structure, we are ready to select data from the cube.
- On the toolbar, click on the MDX icon (it’s the 3rd icon from the left) and click Connect to connect to your Analysis Services instance.
- Close the Object Browser if it’s open so you have wider area to write your query.
- Select Sales database on the drop down list as shown on Figure 7.
- On the empty space on the right hand side, type the following MDX statement and click on Execute (or press F5).
- The query output is shown in Figure 8 below.
- Please take a moment to look at the basic MDX statement on Listing 1 above. Sales Amount is on the column, Month is on the row and Product Category is on the where clause. We say that Sales Amount and Month are on the query axis and Product Category is on the slicer axis. To put it simply, query axis means
SELECTclause; where as slicer axis means theWHEREclause.
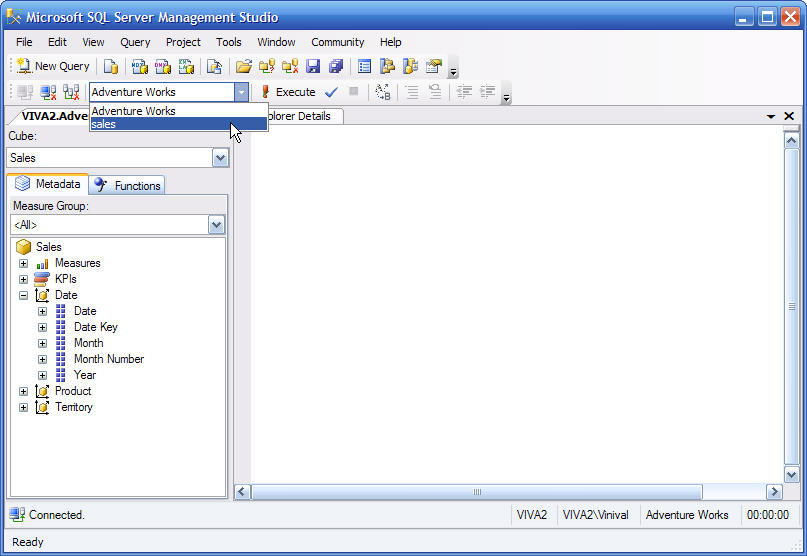
Figure 7. Choosing Analysis Services database
select {[Measures].[Sales Amount]} on columns,
{[Date].[Month].members} on rows
from sales
where [Product].[Product Category].&[Book]
Listing 1. Basic MDX statement
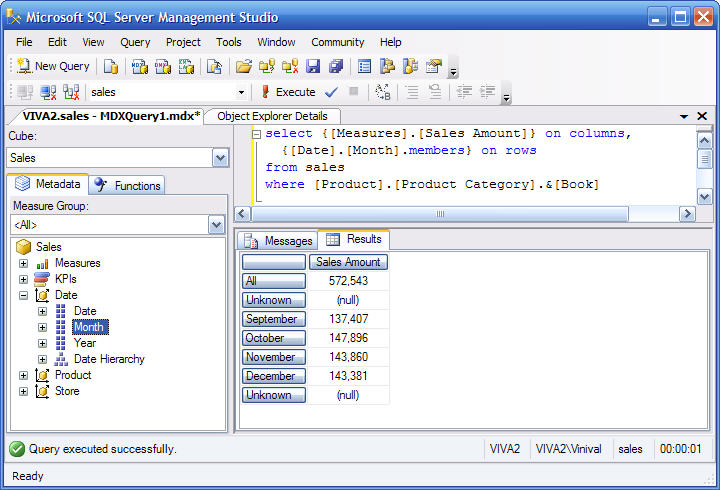
Figure 8. Query output
Please familiar yourself with this basic syntax of MDX by changing the query on listing 1 a little bit. For example:
- Change [Month] to [Year] or to [Date]
- Swap Month and Sales Amount: [Date].[Month].members on the columns and [Measures].[Sales Amount] on the rows
- Remove the where clause
- Swap Product Category and Month: “… {[Product].[Product Category].members} on rows where [Date].[Month].&[December]”
- Remove the “on columns” clause: “select {} on columns, {[Date].[Month].members} on rows … ”
select {[Measures].[Sales Amount]} on columns,
non empty {[Date].[Month].members} on rows
from sales
where [Product].[Product Category].&[Book]
With that, we have achieved the purpose of this article: to provide a hands-on experience querying a cube using MDX SELECT statements. I hope this exercise had enriched your knowledge horizon.
You may ask “why do we have to select from the cube if we can browse it?”. It’s a good question. The best way to explore an Analysis Services cube is using a cube browsing tool. The cube browser in Analysis Services 2000 was not so user friendly, but in Analysis Services 2005 Microsoft had done a good job improving it. The SSAS cube browser is now very easy to use. To make it even more user friendly in terms of drilling down, up, across and analysing data, people use third party tools. One of the most popular tool for browing Analysis Services cubes is ProClarity, which is now owned by Microsoft.
So why do we need to understand how to SELECT data from a cube? Because we need to define custom calculation such as custom measure, default member, Key Performance Indicators, etc. Yes we can survive in todays’ Analysis Services world without knowing MDX, but sooner or later we will come across it. There will come the time where we need to create derived attribute or measure in our cube and we need to use MDX. Also when we need to import the content of a cube into a table for reconciliation purposes.
Lucky for us who uses SQL Server Reporting Services, that we can visually compose the MDX SELECT statements in Business Intelligence Development Studio. SSRS 2005 has a build-in tool called MDX Query Designer which allow us to use drag and drop approach to compose the MDX query when building the data set for the report. I explained how to use this tool and how to build a report querying data from Analysis Services cubes in the Chapter 12 of my book, Building A Data Warehouse: With Examples in SQL Server. But sometimes we are not so lucky, for example where the company or client we work for uses SQL Server 2005 only as a database engine but they use Business Object or Cognos for their reporting tool, rather than Reporting Services.

In the Resources section below I include the DDL script, the Data Population Script, the cube creation XMLA and the SSAS Solution if you want to check any details or want to develop/play a bit more with the cube. So you can recreate the database by executing the DDL and populate the database. When opening the SSAS solution you need to change the data source to point to your SQL Server. The XMLA is for recreating the cube (empty) directly on the SSAS server.
Thank you for reading. As usual I welcome any comments and feedback in the discussion forum.
Vincent Rainardi
21th December 2007
Author of Building a Data Warehouse: With Examples in SQL Server
