

Security audits are generally a part of a DBA’s life, with particular focus in my domain on General Data Protection Regulation (GDPR) and Payment Card Information (PCI). One of the more entertaining questions that an auditor may ask is along the lines of “Do you know where your sensitive data is?” usually closely followed by “And can you prove it?”.
Microsoft introduced Data Discovery and Classification in order to help address such issues. I first saw this at a demonstration during SQL In The City and was quite impressed. However, it can’t be tailored and therefore might not fit everybody’s purposes.
To that end Redgate have developed a tool called the ‘SQL Data Catalog’ that enables a user to add classification information to columns within a database. We can use this information to categorise our data in a way that meets our requirements. It is then possible to produce reports that can assist you with supplying information to the auditors and in providing a documented view of your data classifications.
Data Catalog – First View
For the purpose of this demonstration I have installed the AdventureWorks2014 database onto an empty test server. When the Data Catalog initially loads it will request a server to examine and this resulting initial view indicates that it has no classification information for any databases on this server. The amount if classified data (at the server level) is indicated by the summary panel, which shows a ‘donut’ chart that is currently entirely red. The key next to it shows that red is used to signify ‘Not Classified’.
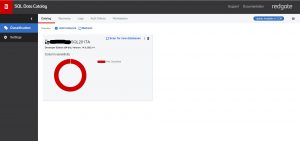
Fig 1 - Data Catalog/Data Catalog
By clicking onto this summary panel you will drill down to the see the same type of summary but against each user database on this server.
Currently, there are no classifications against this database. However, there is a comment beneath the donut chart that states it has 51 classification suggestions, intending to make your task of classifying the data a little easier.
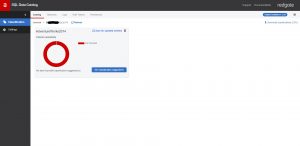
Fig 2 - Notice the classification suggestions in blue.
Clicking on the ‘See classification suggestions’ button that is in the bottom right corner of the panel produces a dialog that shows the software’s suggestions for the columns within the database. These suggestions are created by the software examining the column names and looking for recognized words or abbreviations.
The columns are assigned two pieces of data – ‘Information Type’ and ‘Sensitivity Label’. Information Type is used to group the column into the type of data. For example, this might be credit card information, health-related or banking details. Having chosen an Information Type the sensitivity of the data for this column can be decided. It may be that the data on a particular column is not considered sensitive, or it could be covered by GDPR regulations. This Sensitivity Label is used to signify this degree of sensitivity that is to be assigned to this particular column.
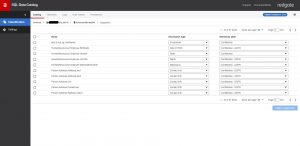
Fig 3 - Column classifications
OK, some of those suggestions aren’t brilliant, but it is a starting point, and you can accept or change these suggestions as you see fit.
So where does it get the ‘Information Type’ and ‘Sensitivity Label’ setting from? That is where the core of this system comes in – the Taxonomy, which is accessed by clicking on the ‘Taxonomy’ tab shown towards the top of the screen.
The dialog screen that is then produced shows the taxonomy dialog, which is already populated with default values supplied by Microsoft. The Microsoft default cannot be deleted but you can add your own, which are signified by the darker shade of blue. Additional tags can be created too, as shown with the ‘Regulation’ group of tags towards the bottom of the following screen-shot. These can be applied to a column as single values, or in multiples, as signified by the ‘Multi-valued’ setting shown on the right of the screen.
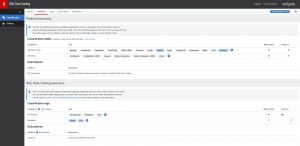
Fig 4 - Classification taxonomy
Having created a taxonomy that suits the purposes of your data, you can then assign classifications against the columns of a database.
When assigning classifications there is an extensive search facility within Data Catalog, to locate columns based upon a wide range of parameters and then update the classifications for those columns individually. In the following example I searched for columns containing ‘name’ and am about to update the classification details for one of the columns the search located. Note that the MS_Description is also shown, although it cannot be updated here. Ensuring you have informative descriptions is a considerable help with this task (SQL Doc is very useful for this area).
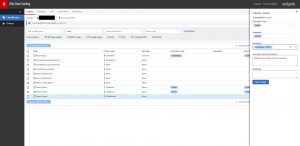
Fig 5 - Applying the taxonomy to columns
Having updated the information for several columns the ‘donut’ for the AdventureWorks2014 database shows the ratio of classifications applied against not classified, as shown by the coloured key alongside the donut. In this example it is obvious that there is still quite a bit of work to do, as the red colour for ‘Not Classified’ is the largest by far.
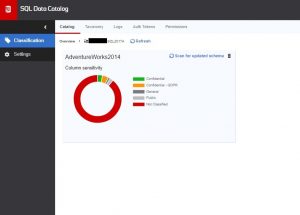
Fig 6 - Updated summary of classifications for a database
It isn’t just a Pretty Interface
As you can imagine, classifying all columns within a database via this interface could be a long task. However, there is an extensive PowerShell library associated with Data Catalog as well as RESTful API – so there are several options available for the more sizeable tasks.
Extracting the Details
There is a facility within Data Catalog for exporting information to a csv file but there are limitations with this, bearing in mind the flexibility of the taxonomy functionality.
The information that you supply into Data Catalog is stored in a central database that is created by Data Catalog when it is first installed. This provides a wealth of possibilities for reporting.
At the time of writing this article we have a PowerBI report that shows a breakdown of data sensitivity, regulation and type for a selected server and can drill down to the database.
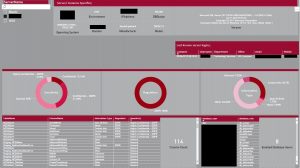
Fig 7 - Power BI Reporting of classifications
Under development is a scatter chart which will show how much sensitive data (by row definition or number of rows of data) is across our server estate. Such information is very useful for the Information Security department and also provides detailed information for our various audits.
And There’s More
At the time of writing this article Data Catalog is still in development and I’m part of the Early Access Program (EAP). There are enhancements being made to security, auditing of the Data Catalog data itself and many other areas – so this article only provides a taste of what this product is capable of.
Additional Benefits
A side benefit I have discovered with this product is that I get to look very closely at the design of databases in my domain. Because these databases were here long before I was employed by this company I don’t have the detailed knowledge of their purpose and design. Looking at the data types, table structures and relationships has helped with suggesting several areas for improvement. In addition I have created an Information Type of ‘Not Known’, which I use this to flag columns where I cannot ascertain a columns purpose, effectively flagging them for further research. I have found this useful for finding gaps in our documentation for our databases and processes.
Conclusion
This promises to be yet another useful tool in the Redgate collection. While not the most exciting subject, categorizing sensitive data and being able to track it is an important part of many systems and the penalties for mistakes in this area can be severe.
Further Reading
SQL Data Discovery and Classification - https://docs.microsoft.com/en-us/sql/relational-databases/security/sql-data-discovery-and-classification?view=sql-server-2017
SQL Doc - https://www.red-gate.com/products/sql-development/sql-doc/
Redgate Products - https://www.red-gate.com/products/
