Query Help
-
Hi,
I was tasked to address the following requirement.
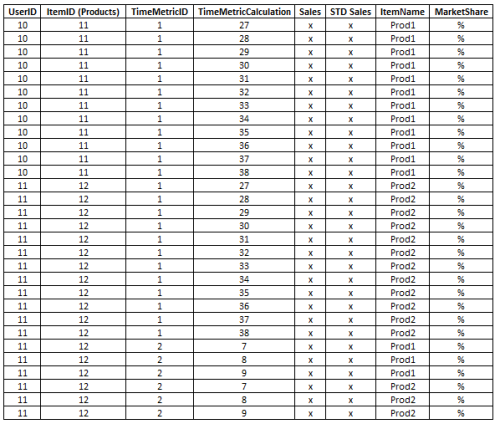
A table contains the weekly (last 12 weeks) and monthly sales (last 3 months) getting down to user, territory and product/market level. So, I managed to build up the data and came up with the following structure. Below script is carved out for testing purpose as it contains some rows to fiddle with.
In real data set there are hundreds of users associated with territories as well as products/markets.
- ItemID refers if that particular item is Product or Market. It is linked to an Item table at the database layer. There may be more than one ItemID assigned to one sales person. In other words, each Sales Person are responsible for multiple products and their products can be in different markets.
- TerritoryCode - There will be more than one territory assigned to each sales person.
- TimeMetricID refers if it displays weekly or monthly sales. TimeMetricID = 1 (Weekly), TimeMetric = 2 (Monthly)
- TimeMetricCalculation displays weeks and months depending on TimeMetricID
- Sales and STD Sales displaying the sales. I need to retrieve market share for both Sales and STD Sales in different columns.
- ItemName is linked to ItemID as it shows the ItemName of each particular ItemID
- ItemType refers if the item is Product or Market.Things went good till when it comes down to calculate market shares. 🙂 So I got stuck as I don't know how I can pull this off as the table contains weekly and monthly sales for each product and market.
The products available in the table constitute markets, so finding out the market share (for every week and month) for each product requires some sort of calculation that I couldn't figure out. 🙁
Please let me know if there are missing parts that need to be filled.
CREATE TABLE FCT_TBL (
UserID INT NOT NULL,
ItemID INT NOT NULL,
TerritoryCode INT NOT NULL,
TimeMetricID INT NOT NULL,
Year INT NOT NULL,
TimeMetricCalculation INT NOT NULL,
Sales FLOAT NOT NULL,
STDSales FLOAT NOT NULL,
ItemName NVARCHAR(100) NOT NULL,
ItemType NVARCHAR (55) NOT NULL
);
INSERT INTO FCT_TBL
(UserID, ItemID, TerritoryCode, TimeMetricID, Year, TimeMetricCalculation, Sales, STDSales, ItemName, ItemType)
VALUES
(10,11,1,1,2016,27,110,275,'Prod1','Product'),
(10,11,1,1,2016,28,0,0,'Prod1','Product'),
(10,11,1,1,2016,29,0,0,'Prod1','Product'),
(10,11,1,1,2016,30,155,387.5,'Prod1','Product'),
(10,11,1,1,2016,31,48,120,'Prod1','Product'),
(10,11,1,1,2016,32,480,1200,'Prod1','Product'),
(10,11,1,1,2016,33,0,0,'Prod1','Product'),
(10,11,1,1,2016,34,0,0,'Prod1','Product'),
(10,11,1,1,2016,35,0,0,'Prod1','Product'),
(10,11,1,1,2016,36,19,47.5,'Prod1','Product'),
(10,11,1,1,2016,37,28,70,'Prod1','Product'),
(10,11,1,1,2016,38,255,637.5,'Prod1','Product'),
(10,12,1,1,2016,27,0,0,'Prod2','Product'),
(10,12,1,1,2016,28,10,10,'Prod2','Product'),
(10,12,1,1,2016,29,0,0,'Prod2','Product'),
(10,12,1,1,2016,30,0,0,'Prod2','Product'),
(10,12,1,1,2016,31,25,25,'Prod2','Product'),
(10,12,1,1,2016,32,175,175,'Prod2','Product'),
(10,12,1,1,2016,33,145,145,'Prod2','Product'),
(10,12,1,1,2016,34,113,113,'Prod2','Product'),
(10,12,1,1,2016,35,0,0,'Prod2','Product'),
(10,12,1,1,2016,36,0,0,'Prod2','Product'),
(10,12,1,1,2016,37,117,117,'Prod2','Product'),
(10,12,1,1,2016,38,0,0,'Prod2','Product'),
(10,15,1,1,2016,27,1300,1375,'Mrk1','Market'),
(10,15,1,1,2016,28,3522,5100,'Mrk1','Market'),
(10,15,1,1,2016,29,2692,4200,'Mrk1','Market'),
(10,15,1,1,2016,30,4541,4643,'Mrk1','Market'),
(10,15,1,1,2016,31,1867,2300,'Mrk1','Market'),
(10,15,1,1,2016,32,566,1050,'Mrk1','Market'),
(10,15,1,1,2016,33,3714,4205,'Mrk1','Market'),
(10,15,1,1,2016,34,265,265,'Mrk1','Market'),
(10,15,1,1,2016,35,6786,7010,'Mrk1','Market'),
(10,15,1,1,2016,36,4741,6651,'Mrk1','Market'),
(10,15,1,1,2016,37,6993,6486,'Mrk1','Market'),
(10,15,1,1,2016,38,1925,2981,'Mrk1','Market'),
(10,16,1,1,2016,27,1382,2085,'Mrk2','Market'),
(10,16,1,1,2016,28,6165,7100,'Mrk2','Market'),
(10,16,1,1,2016,29,3943,5357,'Mrk2','Market'),
(10,16,1,1,2016,30,6155,6500,'Mrk2','Market'),
(10,16,1,1,2016,31,4839,4839,'Mrk2','Market'),
(10,16,1,1,2016,32,3853,3853,'Mrk2','Market'),
(10,16,1,1,2016,33,1496,2500,'Mrk2','Market'),
(10,16,1,1,2016,34,4498,5323,'Mrk2','Market'),
(10,16,1,1,2016,35,1084,1753,'Mrk2','Market'),
(10,16,1,1,2016,36,1341,1341,'Mrk2','Market'),
(10,16,1,1,2016,37,3240,3550,'Mrk2','Market'),
(10,15,1,1,2016,38,259,550,'Mrk2','Market'),
(10,11,1,2,2016,7,265,662.5,'Prod1','Product'),
(10,11,1,2,2016,8,528,1320,'Prod1','Product'),
(10,11,1,2,2016,9,302,755,'Prod1','Product'),
(10,12,1,2,2016,7,10,10,'Prod2','Product'),
(10,12,1,2,2016,8,458,458,'Prod2','Product'),
(10,12,1,2,2016,9,117,117,'Prod2','Product'),
(10,15,1,2,2016,7,12055,15318,'Mrk1','Market'),
(10,15,1,2,2016,8,6412,7820,'Mrk1','Market'),
(10,15,1,2,2016,9,20445,23128,'Mrk1','Market'),
(10,16,1,2,2016,7,17645,21042,'Mrk2','Market'),
(10,16,1,2,2016,8,14686,16515,'Mrk2','Market'),
(10,16,1,2,2016,9,5924,7194,'Mrk2','Market');CREATE TABLE ITEMS (
ItemID INT NOT NULL,
ItemTypeID INT NOT NULL,
ItemName INT NOT NULL,
OriginalID INT NOT NULL
);INSERT INTO ITEMS
(ItemID, ItemTypeID, ItemName, OriginalID)
VALUES
(11,1,'Prod1',1),
(12,1,'Prod2',2),
(15,2,'Mrk1', 3),
(16,2,'Mrk2',4)Expected result set is as follows;

Thanks in advance -
What have you tried to meet your requirements?
- seismicbeat - Tuesday, June 12, 2018 5:18 AM
Forgive my ignorance but I'm not sure what you mean by the following, especially since you only have "x"s in the expected results example.
- Sales and STD Sales displaying the sales. I need to retrieve market share for both Sales and STD Sales in different columns.
I also need to know what you want to base the market share on. In other words, what constitutes the "total market" that each sale should be compared against? I'm asking because I'm just not familiar with your data and the answers to those questions aren't self evident from your description (and thanks for taking the time to post consumable data).
--Jeff Moden
RBAR is pronounced "ree-bar" and is a "Modenism" for Row-By-Agonizing-Row.
First step towards the paradigm shift of writing Set Based code:
________Stop thinking about what you want to do to a ROW... think, instead, of what you want to do to a COLUMN.Change is inevitable... Change for the better is not.
Helpful Links:
How to post code problems
How to Post Performance Problems
Create a Tally Function (fnTally) -
Hi Lynn,
Thank you for the reply. 🙂
As I previously mentioned that the above table is what I came up with after combining the separate data from different tables.
Right after I posted this I also appended quarter sales to display in the presentation layer. There are also dimension tables running behind, but I'm not going to put whole stuff here.
The following script retrieves weekly, monthly and quarterly sales from different tables and put them in an item table.
I changed table and column names, but it gives you the idea.
TRUNCATE TABLE ITEMTABLE
INSERT INTO ITEMTABLE
SELECT
I.ItemID,
BC.TerritoryCode,
1 AS TimeMetricID, --TimeMetricWeek
WD.YEAR,
WD.WEEK AS TimeMetricCalculation,
WD.Sales AS Sales,
(WD.Sales * ISNULL(CD.CoEff, 1)) AS STDSales
FROM
SOMETABLE WD
INNER JOIN Items I ON I.ItemName = WD.Product AND I.ItemTypeID = 1 --ONLY PRODUCTS
INNER JOIN Markets M ON M.Market = WD.Market
INNER JOIN TerritoryCodes BC ON BC.Territory = WD.Territory
LEFT JOIN ProdCoEff CD ON CD.ProductName = WD.Product
INSERT INTO ITEMTABLE
SELECT
I.ItemID,
BC.TerritoryCode,
2 AS TimeMetricID, --TimeMetricMonth
WD.YEAR,
WD.MONTH AS TimeMetricCalculation,
WD.Sales AS Sales,
(WD.Sales * ISNULL(CD.CoEff, 1)) AS STDSales
FROM
SOMETABLE WD
INNER JOIN Items I ON I.ItemName = WD.Product AND I.ItemTypeID = 1 --ONLY PRODUCTS
INNER JOIN Markets M ON M.Market = WD.Market
INNER JOIN TerritoryCodes BC ON BC.Territory = WD.Territory
LEFT JOIN ProdCoEff CD ON CD.ProductName = WD.ProductINSERT INTO ITEMTABLE
SELECT
I.ItemID,
BC.TerritoryCode,
3 AS TimeMetricID, --TimeMetricQuarter
WD.YEAR,
WD.QUARTER AS TimeMetricCalculation,
WD.Sales AS Sales,
(WD.Sales * ISNULL(CD.CoEff, 1)) AS STDSales
FROM
SOMETABLE WD
INNER JOIN Items I ON I.ItemName = WD.Product AND I.ItemTypeID = 1 --ONLY PRODUCTS
INNER JOIN Markets M ON M.Market = WD.Market
INNER JOIN TerritoryCodes BC ON BC.Territory = WD.Territory
LEFT JOIN ProdCoEff CD ON CD.ProductName = WD.ProductI applied exactly the same thing for Markets but joining additional tables. There are two queries besides the below one that retrieve monthly and quarterly data. Similar method that I applied above for Products.
INSERT INTO ITEMTABLE
SELECT
I.ItemID,
BC.TerritoryCode,
TM.TimeMetricID, --TimeMetricWeek
WD.Year,
WD.Week AS TimeMetricCalculation,
SUM(WD.Sales) AS Sales,
SUM((WD.Sales * ISNULL(CD.CoEff, 1))) AS STDSales
FROM
SOMETABLE WD
INNER JOIN MarketDefinition MD ON MD.Product = WD.Product AND MD.ShowInMarket = 1
INNER JOIN Items I ON I.ItemName = MD.Market AND I.ItemTypeID = 2 --ONLY PRODUCTS
INNER JOIN Markets M ON M.Market = MD.Market
INNER JOIN TerritoryCodes BC ON BC.Territory = WD.Territory
LEFT OUTER JOIN TimeMetric TM ON TM.TimeMetricID = 1
LEFT JOIN ProdCoEff CD ON CD.ProductName = WD.Product
GROUP BY
I.ItemID,
BC.TerritoryCode,
TM.TimeMetricID, --TimeMetricWeek
WD.Year,
WD.Week
Then I expanded the result set for getting down to sales person level. Below query gives me the product sales, I inserted the market sales as well using a similar query. Hope this helps 🙂
Sorry for being late in replying since compiling this took me so long to reply. 🙁
--PRODUCT
TRUNCATE TABLE FCT_TBL
INSERT INTO FCT_TBL
SELECT
RTP.UserID,
I.ItemID,
BC.TerritoryCode,
TM.TimeMetricID,
ID.Year,
ID.TimeMetricCalculation,
(ID.Units * BR.Weight) AS UNITS,
(ID.STDUnits * BR.Weight) AS STDUNITS
FROM
SOMETABLE RTP
INNER JOIN SPTerritory BR ON BR.UserID = RTP.UserID
INNER JOIN Items I ON I.ItemName = RTP.Product AND I.ItemTypeID = 1
INNER JOIN ITEMTABLE ID ON ID.ItemID = I.ItemID AND ID.TerritoryCode = BR.TerritoryCode
INNER JOIN TerritoryCodes BC ON BC.TerritoryCode = BR.TerritoryCode
INNER JOIN TimeMetric TM ON TM.TimeMetricID = ID.TimeMetricID -
I'm still a bit lost. You provided the DDL for the table(s), consumable sample data, and even your expected results (apparently needing more explanation based on Jeff's questions), but you have not shown us what you have done to try and get your expected results. Having that will also help us help you.
-
Hi Jeff and Lynn,
Basically I failed to provide every possible detail to help you out, sorry for that. 🙁
I actually couldn't carry this one step further, that's why I'm failing to display what I have done to try.
STDSales differentiates itself from Sales because STDSales = Sales * PreDefinedValue
PredefinedValues are located in a table as I tried to illustrate it above with so called "ProdCoEff" table. There are special multipliers defined for certain products. That's how it works actually.
The tough part is (to me) that markets are being constituted by products. For example;
ProductA, ProductB and ProductC constitutes MarketA while ProductD and ProductE constitute MarketB. Keeping both product and market sales in the same table makes things much more complicated for me.
There are hundreds of sales person each has more than one territory and they are responsible for multiple products, and these products constitute market sales. The consumable data I provided above needs to be explained well, that was my bad.
Product1 is one of the products that constitute Market1
Product2 is one of the products that constitute Market2The real data has much more products that constitute markets. What I need is to eliminate territories which means that I need to get total sales for each Sales Rep and then find the product market shares for each timemetric (weekly and monthly). This is where I stuck, anyway thanks for your comments. 🙂
-
I think the problem here is that in your original source tables you have SOMETABLE, Items, Markets, TerritoryCodes, ProdCoEff
but I don't see anything from the Market table making it into FCT_TBL, so you can't do the necessary grouping.If you had Market in FCT_TBL, then you could do an aggregate with a windowed function something like:
CAST(f.Sales / SUM(f.Sales) OVER (PARTITION BY f.TimeMetricID, f.Year, f.TimeMetricCalculation, f.Market) AS decimal(5,4)) AS MarketShare
Viewing 7 posts - 1 through 6 (of 6 total)
You must be logged in to reply to this topic. Login to reply