Add a New Fact Table to Existing Data Warehouse
-
I have been tasked with adding a new fact table to an existing Data Warehouse. Due to some constraints that are outside of my control (political / organizational) and knowing that this new fact table data belongs to a particular business silo, I decided to create a separate datamart. I have accomplished this by creating SSIS packages that copy the pertinent DW tables over to my own SQL Server node and database called the ES_RTR. I also have a staging DB called ES_RTR_Staging that all the incremental changes flow through via the SSIS packages.
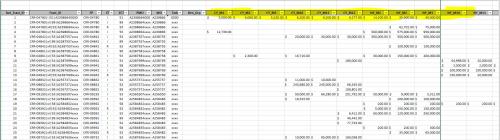
Now I need to integrate fact_Forecast (new table) into the data model and I'm wondering where I should begin. I think that researching the existing DW to find the T-SQL that the original designer of the DW used to join the existing fact tables is a potential starting point. I'm kind of lost, though when it comes to the "grain" of this new table. It is very different than the other tables in that it takes a MONTHLY snapshot of what a particular analyst thinks each project will spend (their forecast) BY future months and future years (e.g. CY_M1... CY_M12, NY_M1... NY_M12, FY_2... FY_5).

Here is a link to the SQL Script that will quickly recreate this whole table: https://drive.google.com/drive/folders/0Bza4zQbuuU68OVEzNE56NV9lN28?usp=sharing
Do I need to "lengthen" this table by making every single forecast value it's own row with a new column to demarcate it's MONTH/YEAR value, or do I leave it "wide" and retain all these columns as measures?
-
So you have Sales (or something similar) and now you want to add a Forecast fact table? They're not the same granularity. They don't belong in the same table. They're "joined" by the fact that they share a bunch of dimensions.
If you go to http://www.daxpatterns.com, Ferrari & Russo posted an example you can download.
-
"Do I need to "lengthen" this table by making every single forecast value it's own row with a new column to demarcate it's MONTH/YEAR value, or do I leave it "wide" and retain all these columns as measures?"
I believe making the table more vertical would be the correct way to go. You can still associate each forecast record in this fact table to your date dimension, such as using the first day of the month, and then utilize attributes of the date dimension to describe the forecast record year and month. - pietlinden - Monday, January 23, 2017 9:43 PM
No. Actually, there are currently (4) other fact tables: fact_Estimates, fact_Actuals (Cost), fact_SES (payments), and fact_Commitments (POs). So, the data is not mixed. The data set that I showed above is strictly forecast data. The existing tables already utilize a star-schema to share similar attributes from (7) dimension tables.
Also, I have the Ferrari and Russo book and even though I do already bring the DW into a PowerPivot data model and plan to do the same with this new DataMart, I don't see how a DAX solution helps me to integrate a new fact table into my current SQL Server solution?
- Chris Harshman - Tuesday, January 24, 2017 6:59 AM
Chris,
So you think that normalizing is a must here? I thought it might be, since there are like 28 different columns that would be considered measures.. I am currently looking at developing an SSIS package with an Unpivot Transformation to make this data set more vertical.
Do you think that is the right solution?
Thanks,
Jerid
- Jerid421 - Tuesday, January 24, 2017 10:07 AM
Actually making a separate row in the fact table for each month instead of separate columns would be normalizing the data. Yes I think it is the best way to represent the data based on the picture you attached, each of those CY_M# and NY_M# columns are really the same measure, just for different points in time. separate rows with a link to your date dimension will be the easiest way for users to work with the data once it's loaded.
Viewing 6 posts - 1 through 6 (of 6 total)
You must be logged in to reply to this topic. Login to reply