Project Background
For the past ten years working as a database administrator it has become painfully obvious that you can never give the user all the information they need. You can spend two weeks defining a dozen reports, and then deliver a report a week for the next three months, and at the end of that time the user will require twelve different reports.
The only real solution to this problem is to put the tools and the data into the hands of the users and let them design, write and produce their own reports. The problem with this solution has been, up until now, that the tools and database structures are just too complicated. You cannot give the user a database with 200 tables, no referential integrity, and no drawings (Entity/Relationship Diagrams - ERDs) to map the data and expect them to produce anything meaningful.
The client company where I am contracting has an existing array of hardware/software products that contain many different types of databases. Both Sybase ASA/ASE and IBM DB2 have been very popular over the past dozen years of these products lives. Reports have been created in many versions of Crystal and Hyperion Brio. One product alone has approximately 400 existing reports. Many of these reports are of an operational nature and will continue to be created from the various existing operational stores; but those of an analytical nature will have to migrate to a reporting solution that is understandable and usable by the end user.
If you have known me for any length of time, you have probably heard me talking about SQL Server being perceived as being so simple that "a monkey can do it." And of course you know that I do not agree. But I must admit that in the thirty-seven years that I have been in this business that the tools are getting easier to use. No monkey can do it... yet.
It was 1984 that "Application Programs without Programmers" was a hot subject. This too will come.
Our goal on this project is to migrate all of this data into a simplified structure and hand the user the keys to the kingdom. We are currently using SQL Server Reporting Services, based on SQL Server 2005, and the related tools to get the job done.
SQL Server Integration Services (SSIS) is the ETL (Extraction, Translation, Load) component of choice... if it can be made to work. Over the past four months we have dealt with the April, June and September betas, or Customer Technology Preview (CTP) as they are commonly called, and experimented with various components.
With the November 7th release of both SQL Server 2005 (SS5) and Visual Studio 2005 (VS5) we have wiped the slate clean, so to speak, and are only tracking issues, problems and possible bugs in the general available (GA) product. This document is being written to explain and document just one such issue: the mysterious disappearance of data.
The Environment
This project is taking the data from two existing products and merging it into one consolidated database. To complicate things a bit there are five or six version of database schemas in each of the two products, and each product may exist multiple times at a customer site. The products store data for a limited time while the consolidated database will store data for six years or more. There are currently no stated intentions of purging or archiving the database so it stands to reason that forever is the solution. Of course, reality may change that and plans for purging or archiving will be created.
Data is being collected from the Sybase databases by Sybase Replication Server. From there it is being pushed directly into a staging area in SQL Server 2005 via Sybase Direct Connect. This staging area will also serve as a reporting store for some of the operational reports that could not be done in the past over long periods of time. These reports will be converted over time to use Reporting Services.
For the users, we are creating a star schema with a single fact table and several dimension tables. It is really quit amazing the work the data architect has done to make this model so compact and concise considering the number of schemas, the differences between them, and the size of both databases and data. A real work of art!
Now, how do we get the data from the relational stores into the reporting schema? SSIS, of course!
A Simple SSIS Solution
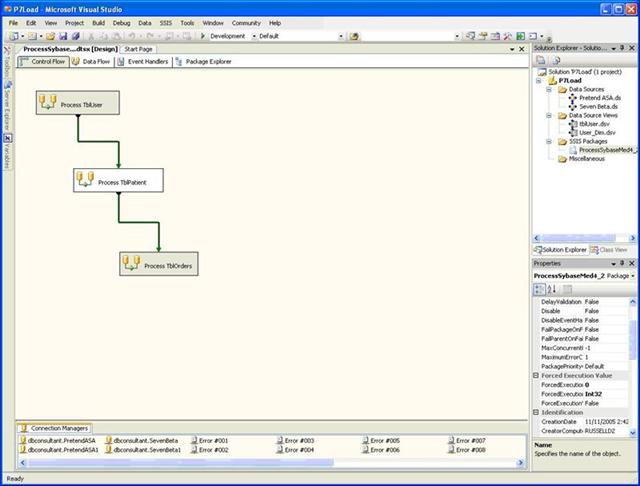
The conceptual view of what needs to be done is very simple. Data needs to be read from the consolidated data store and converted into the appropriate SQL Server formats, typically eliminating the Unicode multi-byte representation, and then either inserted or updated in the reporting store. The "lookup" is by primary key and if a record exists it is updated. If the record does not exist it is inserted. Once a record has been processed a flag is set in the consolidated store so it will not be processed again. This can be done with seven tasks; although we have added four additional flat file destinations for error review. The two tasks to set the update flag have not been added to this pipeline; but that is trivial and was demonstrated in the previous data flow.
The first screenshot shows the Control Flow Panel in the SSIS Integrated Desktop Environment (IDE). For development purposes the first and third tasks in this screen have been disabled. Everything in this paper will be related to the second task: Process TblPatient.
Control Flow Panel Screenshot
Conceptual View into a Data Flow Pipeline
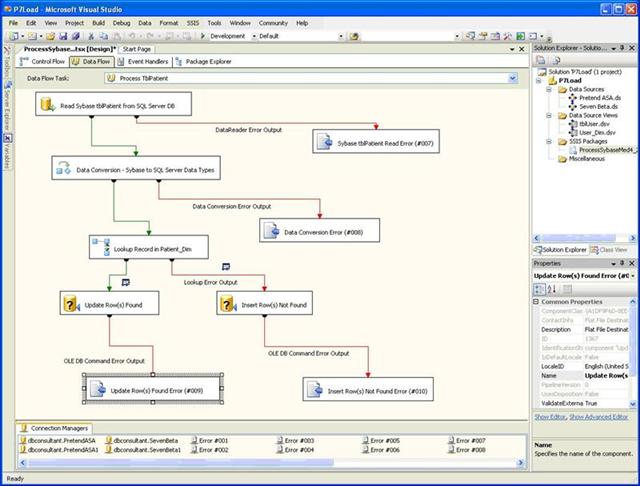
The second screenshot shows the processing described above.
Data Flow Panel Screenshot
Existing Records in the Reporting Store
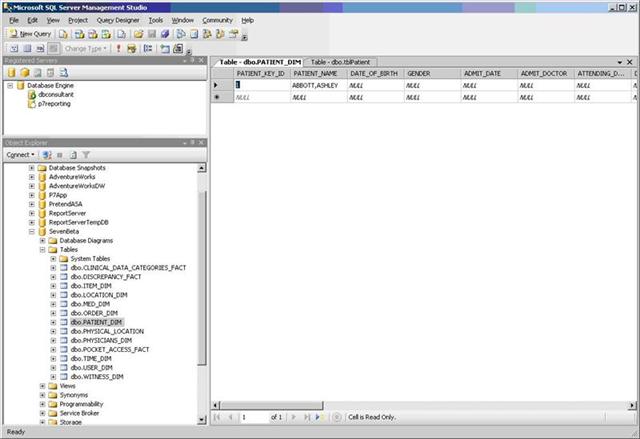
The third screenshot shows that there is one row present in the destination database.
Test Data Screenshot
Source Data
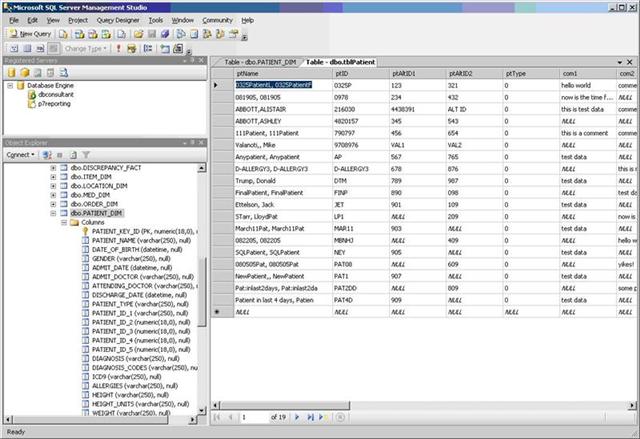
The next screenshot shows that there are nineteen (19) rows of data in the source database.
Test Data Screenshot
Data Viewers are Very Necessary
If you will look back on the data flow panel you will notice two tiny icons on the data flows coming out of the "Update Record in Patient_Dim" task. These are data viewers and have been configured to watch the data pass on each of the outputs from the task. The next screenshot show is of the first viewer and shows that the existing record was found.
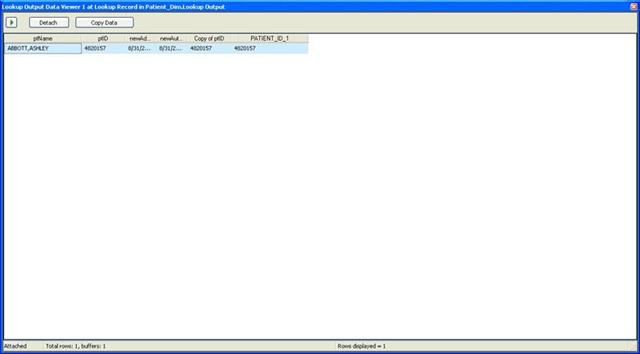
Data Viewer Screenshot
The next screenshot shows the second viewer and shows the eighteen (18) records which do not exist.
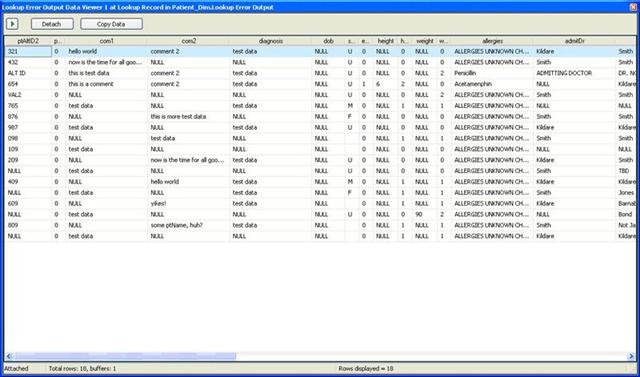
Data Viewer Screenshot
Failure
Okay, so at least the next screen lights up red on the "Insert Row(s) Not Found" task. But that red should be a signal to look at the error output flat file destination. There are two rows in that file. Eighteen rows in... two rows failed.
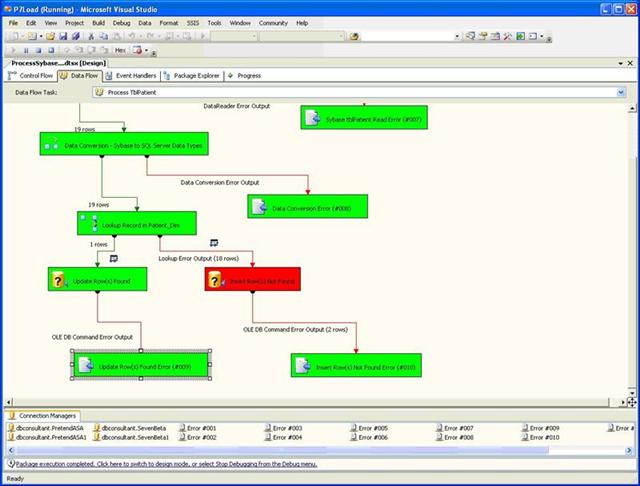
Data Flow Screenshot
Error Output Flat File Destination
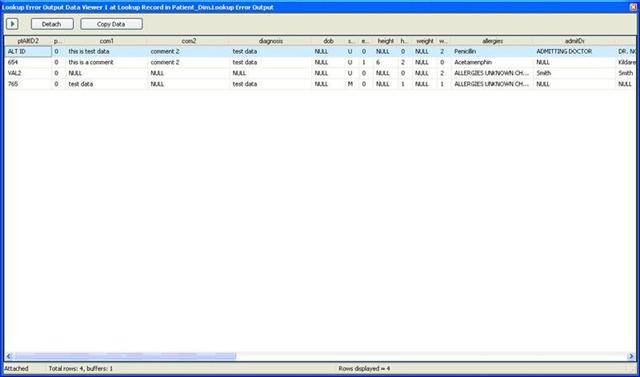
The next screenshot shows the name, id, error code and error column of the failed rows.
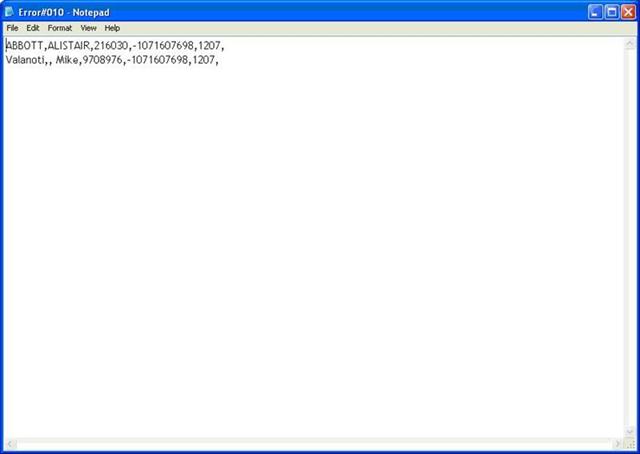
Error Output File Screenshot
And I will not even go into the fact that the error code is meaningless, and the error column is really the error code... and that the descriptive value of "1207" is "not available." No. I won't mention that here.
Data Viewers on Second Execution
You really should not have to run a process twice in a row in order to complete a single transaction correctly or trap all of the errors. And furthermore, if this pipeline were complete and we were setting the success flag we might not have been able to run it twice - at least not the same way, using the same source data each time because processed rows would have been flagged and filtered out from the input.
The next screenshot shows that fifteen rows were found. That is correct. And on various attempts we modified the target data to confirm that the update was taking place. It was.
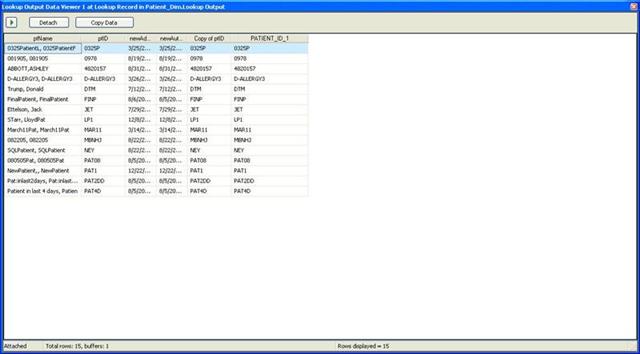
Data Viewer File Screenshot
The next screenshot shows the original four rows which were not found the first time through. They were all four found by the data viewer this time through.
Data Viewer File Screenshot
At Least it is Obviously Broken the Second Time Through
The insert task went red and nothing else completed. Also notice the "Data Conversion Error (#008)" task above in the pipeline was never statused either. Okay, on the second time through we know it is really broken.
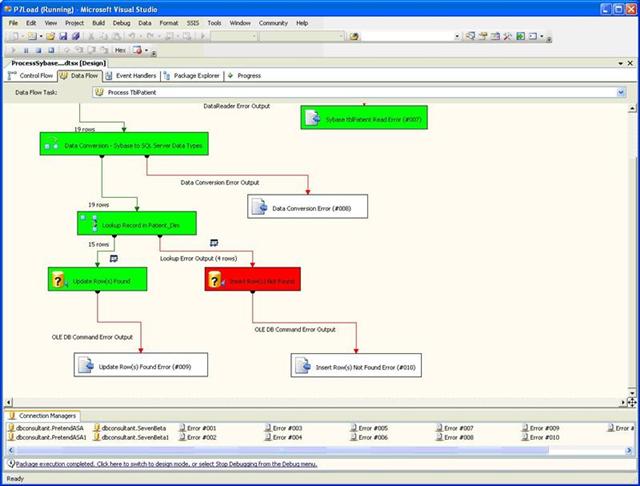
Data Flow Panel Screenshot
A Final Look at the Target Destination Database
The Patient_Dim table now has fifteen rows. One was updated and fourteen were inserted. We know because we ran the process twice that we have four error rows; but our error output file only trapped two of those errors. Had we not used the data viewer and carefully followed what was going on we would have never known that data was lost.
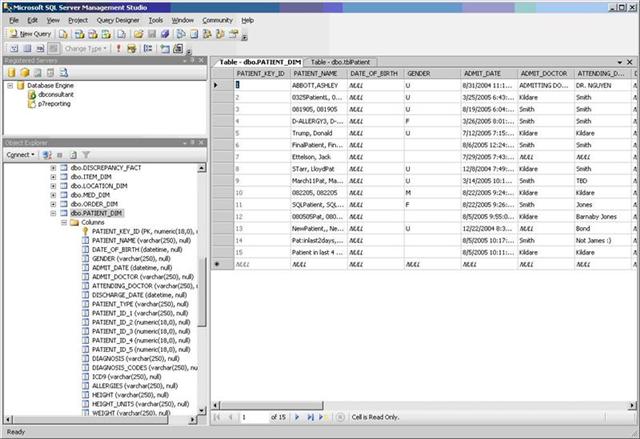
Test Data Screenshot
Conclusions
Historically this is typical of a new Microsoft Product. There is a lot to be found wrong with it; but there is also a lot to be found right with it. There are a few other problems that are also potential show stoppers; but this one deserves my time and attention today. Granted that we are using test data and that test data sometimes has unknown origins. It also sometimes has intentional corruption thrown in just to see how it will be dealt with by the tools and the development team. But that should not be an excuse for loss of data. Loss of data is a serious offense. We are not just talking about loss of revenue; but, that is important, too. In the medical arena we are talking about the loss of lives. If the report being generated is a detailed description of the drugs you are taking and the doctor does not have the right information would you want to be in that bed under his care with the information he has available?
This data loss could have easily been overlooked. Had it not been for the total failure to complete on the second execution it might not have been caught. While "reporting" is being implemented for end-users, it is not anticipated that they will ever be doing their own transformations; however, more experienced users surely could be using this tool in some situations. Microsoft has a series of articles they call "Project Real" where they describe the developers as being the ones who extend the SSIS tool, and the users as the ones who do the ETL. That is not the case here; but, had this been an end-user, not a programmer, not someone familiar with testing and error handling - yes, this data loss could have been overlooked.
We have better data on the way; but it takes time to create test data, and when "real" data is used, it takes customer agreements, signatures, legal approval and a certain amount of sanitization. And that should NOT be the solution to resolving this issue. Microsoft tools should not lose data dumped into a pipeline. It goes in... it comes out... somewhere.
I firmly believe that we are going to push forward. Personally, I want the tool to work. And the company wants the tool to work as well. But this is corporate America. This project is just one of many. There are high-powered executives making decisions based on feedback and recommendations from several educated technical staff members. And you had better believe that there is a team of people considering, researching and testing options. This product is important, not just to this company or this project; but to the future of reporting in all walks of life. Products have gotten better, and they will continue to get better. The only question is which product is best?
If it will not work it will not be used.