sys.query_store_query question
-
All,
My query is as follows:
SET DATEFORMAT dmy
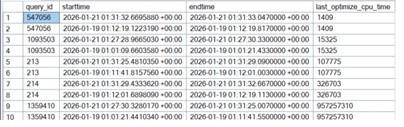
SELECT p.query_id,
DATEADD(MICROSECOND,-rs.max_duration,rs.first_execution_time) AS starttime,
first_execution_time AS endtime, q.last_optimize_cpu_time
FROM sys.query_store_query_text t JOIN sys.query_store_query q
ON t.query_text_id = q.query_text_id
INNER JOIN sys.query_store_plan p ON q.query_id = p.query_id
INNER JOIN sys.query_store_runtime_stats rs ON rs.plan_id=p.plan_id
WHERE OBJECT_NAME(q.object_id) = 'x'
AND (rs.first_execution_time BETWEEN '19/01/2026 00:00:00' AND '19/01/2026 23:59:59'
OR rs.first_execution_time BETWEEN '21/01/2026 00:00:00' AND '21/01/2026 23:59:59')The results are as follows:

Am I correct in understanding that:
1) The value 957257310 in last_optimize_cpu_time indicates that SQL server took 15 minutes to optimise the query before starting to run it?
2) The object x is a procedure. Am I correct that the optimisation would take place before any of the queries ran?
Apologies if I missed an obvious error somewhere.
Thanks
-
It does seem that this is 15 minutes compilation/optimization. This should be a one time cost (until the proc changes) that is incurred. This seems very high, but you might check the number of times the query ran since it was compiled
SELECT q.query_id,
       q.last_optimize_cpu_time / 1000000.0 AS optimize_cpu_seconds,
       COUNT(*) AS execution_count
FROM sys.query_store_query q
WHERE q.query_id = 957257310 -
Thanks for your help.
It runs once a day and it looks to be compiling every day.
It's a forced plan with an optimization replay script so I'm wondering if that has something to do with it. I saw one or two forum posts with people having similar issues and they turned optimised plan forcing off. I'm wondering if I've hit the same unusual issue.
This is on production so I'm going to test in our test system first. From our own statistics I can see that the procedure run times are about the same as production but, for some reason query store, isn't capturing the queries. Therefore, as far as I know, I can't see the query level data and can't verify test has the same issue. So I'm going to try and fix the query store issue first.
If I find a solution/anything useful I'll add another post in case it's useful to others.
Thanks
-
It looks like the query optimizer is timing out. You can look at this post to determine how to verify that and get some suggestions for how to avoid it.
I think you're probably also onto something with the optimization replay script. But you may just have a very complex query in the sp. If you can reduce the complexity of the query, you might be able to help the optimizer. I remember addressing similar issue by dividing the query into two queries. One that has all of the parameters and saves data to a temp table and then another that uses that temp table to do the rest of the logic. I hope this helps.
-
Thank you for your help.
You are correct it's timing out so I need to look at that further.
I turned off optimised plan forcing for that query on test and it's dropped the compilation time down from about 15 minutes to about 3 seconds. I haven't made the change on live yet.
-
That column is easy to misread, last_optimize_cpu_time in sys.query_store_query is CPU time spent compiling or optimizing the query, not how long the query actually ran. So if you see a massive number there it usually means the optimizer struggled complex query, forced plans, parameter sniffing etc. not that the query executed for that long. In your case the giveaway is that disabling forced plan optimization made the “15-minute” time drop to seconds, which confirms the time was burned during compilation, not execution. If you want execution cost, you need to look at runtime stats like duration or CPU from sys.query_store_runtime_stats, not the optimize columns.
Viewing 6 posts - 1 through 6 (of 6 total)
You must be logged in to reply to this topic. Login to reply