SSRS Table Display
-
Wanting to do some complex (at least to me) manipulation of data that looks like this:

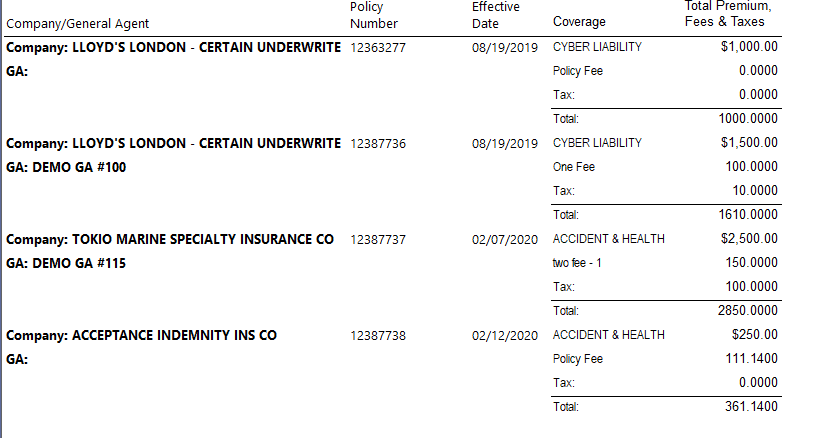
And massage it into an SSRS table that looks like this:
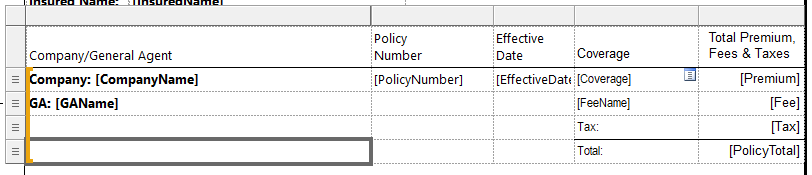
I've made the following attempt:
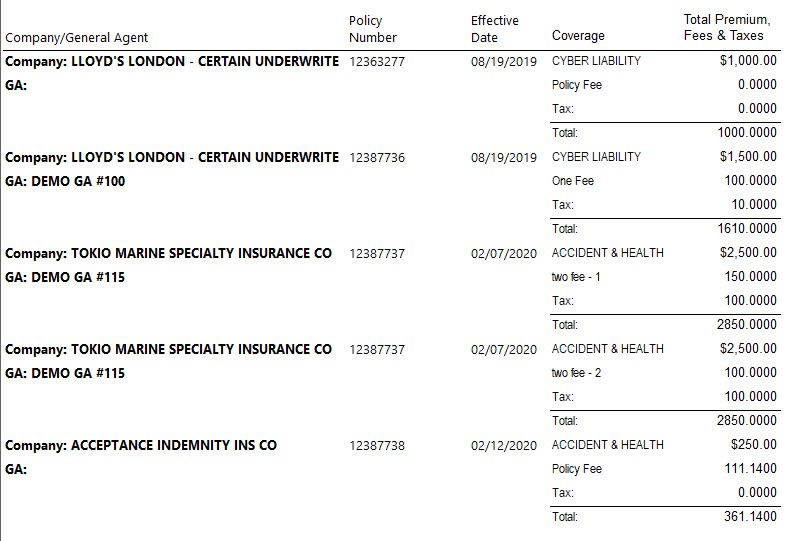
And it is doing something close to what I want, but not quite:
In cases where there are more than one fees per policy, it's repeating some data I don't want repeated. I'm sure it's a simple group setting or something, but I'm not spotting it. Can someone point me in the right direction as to how to solve this need? Or is it something SSRS just won't do?
Thanks!
Jason
The Redneck DBA
-
Thanks for posting your issue and hopefully someone will answer soon.
This is an automated bump to increase visibility of your question.
-
Would be easier to help with some sample data... It can be completely fake, just representative.
-
The first picture in the post represents some sample data. Or do you mean send some SQL to create a table and insert sample data?
The Redneck DBA
- TheRedneckDBA wrote:
The first picture in the post represents some sample data. Or do you mean send some SQL to create a table and insert sample data?
The latter so that people can run the scripts and test out the scenario for you. Otherwise, they would need to type out create table statements and inserts from the pictures, which most people won't have time to do.
Sue
-
Makes sense. Here you go:
CREATE TABLE DataTable
(
DataTableID INT IDENTITY(1,1),
QuoteNumber BIGINT,
ProducerName VARCHAR(50),
InsuredName VARCHAR(50),
CompanyName VARCHAR(50),
GAName VARCHAR(50),
PolicyNumber VARCHAR(25),
EffectiveDate DATETIME,
Coverage VARCHAR(30),
Premium MONEY,
Tax MONEY,
FeeName VARCHAR(25),
Fee MONEY,
PolicyTotal MONEY,
BrokerFee MONEY,
QuoteTotal MONEY
)
GO

INSERT INTO DataTable (QuoteNumber, ProducerName, InsuredName, CompanyName, GAName, PolicyNumber, EffectiveDate, Coverage, Premium, Tax, FeeName, Fee, PolicyTotal, BrokerFee, QuoteTotal)
VALUES (1234567, 'ProducerName', 'InsuredName1', 'CompanyName1', '', '11111111', '2020-01-01', 'Coverage1', 1000, 0, 'Policy Fee', 0, 1000, 0.00, 8671.14)

INSERT INTO DataTable (QuoteNumber, ProducerName, InsuredName, CompanyName, GAName, PolicyNumber, EffectiveDate, Coverage, Premium, Tax, FeeName, Fee, PolicyTotal, BrokerFee, QuoteTotal)
VALUES (1234567, 'ProducerName', 'InsuredName2', 'CompanyName2', 'GAName1', '2222222', '2020-01-03', 'Coverage2', 1500, 10, 'One Fee', 100, 1610, 0.00, 8671.14)

INSERT INTO DataTable (QuoteNumber, ProducerName, InsuredName, CompanyName, GAName, PolicyNumber, EffectiveDate, Coverage, Premium, Tax, FeeName, Fee, PolicyTotal, BrokerFee, QuoteTotal)
VALUES (1234567, 'ProducerName', 'InsuredName3', 'CompanyName3', 'GAName2', '33333333', '2020-01-07', 'Coverage3', 2500, 100, 'Two Fee - 1', 150, 2850, 0.00, 8671.14)

INSERT INTO DataTable (QuoteNumber, ProducerName, InsuredName, CompanyName, GAName, PolicyNumber, EffectiveDate, Coverage, Premium, Tax, FeeName, Fee, PolicyTotal, BrokerFee, QuoteTotal)
VALUES (1234567, 'ProducerName', 'InsuredName4', 'CompanyName4', 'GAName3', '33333333', '2020-01-06', 'Coverage4', 2500, 100, 'Two Fee - 2', 100, 2850, 0.00, 8671.14)

INSERT INTO DataTable (QuoteNumber, ProducerName, InsuredName, CompanyName, GAName, PolicyNumber, EffectiveDate, Coverage, Premium, Tax, FeeName, Fee, PolicyTotal, BrokerFee, QuoteTotal)
VALUES (1234567, 'ProducerName', 'InsuredName5', 'CompanyName5', '', '444444444', '2020-01-02', 'Coverage5', 250, 0, 'Policy Fee', 111.14, 361.14, 0.00, 8671.14)
GO
The Redneck DBA
-
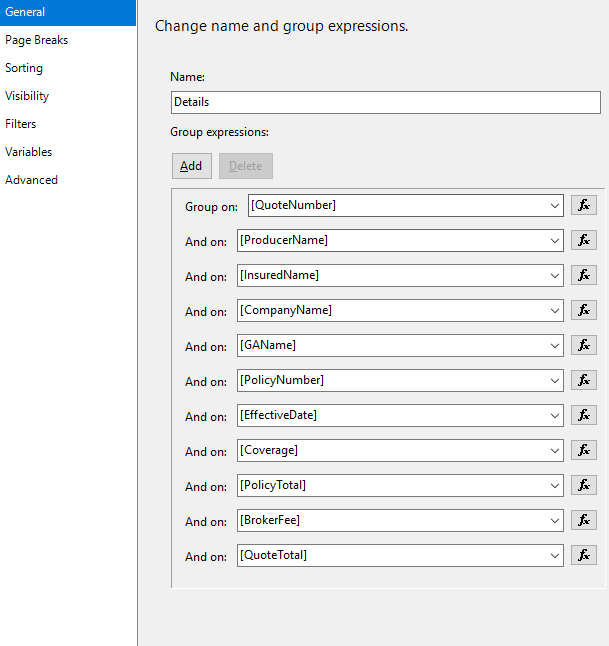
It looks like you do not have a group defined - therefore you are getting each row in the data set as a distinct row in the tablix. You need to add a group that encompasses the columns out to the level of detail you want.
Your sample data will not work for this either, since you have different key values for InsuredName, CompanyName and GAName but in your picture those are the same values.
Jeffrey Williams
“We are all faced with a series of great opportunities brilliantly disguised as impossible situations.”― Charles R. Swindoll
How to post questions to get better answers faster
Managing Transaction Logs -
Oops. Here's updated data.
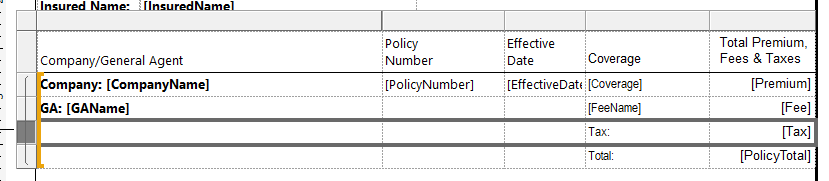
I've tried grouping on everything but FeeName and Fee. And that makes it show up just one record for the Policy, but then doesn't include the 2nd "FeeName/Fee Combination" I'm hoping it to display. Just diplays the first one.
CREATE TABLE DataTable
(
DataTableID INT IDENTITY(1,1),
QuoteNumber BIGINT,
ProducerName VARCHAR(50),
InsuredName VARCHAR(50),
CompanyName VARCHAR(50),
GAName VARCHAR(50),
PolicyNumber VARCHAR(25),
EffectiveDate DATETIME,
Coverage VARCHAR(30),
Premium MONEY,
Tax MONEY,
FeeName VARCHAR(25),
Fee MONEY,
PolicyTotal MONEY,
BrokerFee MONEY,
QuoteTotal MONEY
)
GO

INSERT INTO DataTable (QuoteNumber, ProducerName, InsuredName, CompanyName, GAName, PolicyNumber, EffectiveDate, Coverage, Premium, Tax, FeeName, Fee, PolicyTotal, BrokerFee, QuoteTotal)
VALUES (1234567, 'ProducerName', 'InsuredName', 'CompanyName1', '', '11111111', '2020-01-01', 'Coverage1', 1000, 0, 'Policy Fee', 0, 1000, 0.00, 8671.14)

INSERT INTO DataTable (QuoteNumber, ProducerName, InsuredName, CompanyName, GAName, PolicyNumber, EffectiveDate, Coverage, Premium, Tax, FeeName, Fee, PolicyTotal, BrokerFee, QuoteTotal)
VALUES (1234567, 'ProducerName', 'InsuredName', 'CompanyName2', 'GAName1', '2222222', '2020-01-03', 'Coverage2', 1500, 10, 'One Fee', 100, 1610, 0.00, 8671.14)

INSERT INTO DataTable (QuoteNumber, ProducerName, InsuredName, CompanyName, GAName, PolicyNumber, EffectiveDate, Coverage, Premium, Tax, FeeName, Fee, PolicyTotal, BrokerFee, QuoteTotal)
VALUES (1234567, 'ProducerName', 'InsuredName', 'CompanyName3', 'GAName2', '33333333', '2020-01-07', 'Coverage3', 2500, 100, 'Two Fee - 1', 150, 2850, 0.00, 8671.14)

INSERT INTO DataTable (QuoteNumber, ProducerName, InsuredName, CompanyName, GAName, PolicyNumber, EffectiveDate, Coverage, Premium, Tax, FeeName, Fee, PolicyTotal, BrokerFee, QuoteTotal)
VALUES (1234567, 'ProducerName', 'InsuredName', 'CompanyName3', 'GAName3', '33333333', '2020-01-07', 'Coverage4', 2500, 100, 'Two Fee - 2', 100, 2850, 0.00, 8671.14)

INSERT INTO DataTable (QuoteNumber, ProducerName, InsuredName, CompanyName, GAName, PolicyNumber, EffectiveDate, Coverage, Premium, Tax, FeeName, Fee, PolicyTotal, BrokerFee, QuoteTotal)
VALUES (1234567, 'ProducerName', 'InsuredName5', 'CompanyName4', '', '444444444', '2020-01-02', 'Coverage5', 250, 0, 'Policy Fee', 111.14, 361.14, 0.00, 8671.14)
GO
The Redneck DBA
-
The grouping needs to be defined in the report - not in the SQL. By setting up a group in the report - you can display the detail rows for each 'group' of header rows.
Jeffrey Williams
“We are all faced with a series of great opportunities brilliantly disguised as impossible situations.”― Charles R. Swindoll
How to post questions to get better answers faster
Managing Transaction Logs -
Agreed. I'm apparently just doing it wrong.
The Redneck DBA


Viewing 10 posts - 1 through 10 (of 10 total)
You must be logged in to reply to this topic. Login to reply