SQL server 2014 is very slow
- bmg002 - Wednesday, June 14, 2017 12:18 PM
About wait queries- i have posted. The waits have no significant changes
- pranabpal - Wednesday, June 14, 2017 6:02 PM
Get more RAM.
“Write the query the simplest way. If through testing it becomes clear that the performance is inadequate, consider alternative query forms.” - Gail ShawFor fast, accurate and documented assistance in answering your questions, please read this article.
Understanding and using APPLY, (I) and (II) Paul White
Hidden RBAR: Triangular Joins / The "Numbers" or "Tally" Table: What it is and how it replaces a loop Jeff Moden -
Hi
Please perform the following. Let’s see how we can pinpoint the cause of the slowness.
Firstly, let’s identify the hardware resources bottlenecks. SQL Server performance is affected by the stres on the following resources: (The big 3s)
· CPU
· Disk IO
· MemoryBut before that, please run the query below to capture 2 samples of wait stats (the 2nd capture will be done after 1 hour).
This will run for 1 hour (totally safe to run in production) and it will calculate the difference between the two time periods. It also filters the unnecessary wait stats.
I think this is what Gail is asking you to do earlier.
/*============================================================================
 File:  ShortPeriodWaitStats.sql
Summary: Short snapshot of wait stats
SQL Server Versions: 2005 onwards
------------------------------------------------------------------------------
Written by Paul S. Randal, SQLskills.com(c) 2014, SQLskills.com. All rights reserved.
For more scripts and sample code, check out http://www.SQLskills.com
You may alter this code for your own *non-commercial* purposes (e.g. in a
for-sale commercial tool). Use in your own environment is encouraged.
You may republish altered code as long as you include this copyright and
give due credit, but you must obtain prior permission before blogging
this code.THIS CODE AND INFORMATION ARE PROVIDED "AS IS" WITHOUT WARRANTY OF
ANY KIND, EITHER EXPRESSED OR IMPLIED, INCLUDING BUT NOT LIMITED
TO THE IMPLIED WARRANTIES OF MERCHANTABILITY AND/OR FITNESS FOR A
PARTICULAR PURPOSE.
============================================================================*/IF EXISTS (SELECT * FROM [tempdb].[sys].[objects]
WHERE [name] = N'##SQLskillsStats1')
DROP TABLE [##SQLskillsStats1];IF EXISTS (SELECT * FROM [tempdb].[sys].[objects]
WHERE [name] = N'##SQLskillsStats2')
DROP TABLE [##SQLskillsStats2];
GOSELECT [wait_type], [waiting_tasks_count], [wait_time_ms],
[max_wait_time_ms], [signal_wait_time_ms]
INTO ##SQLskillsStats1
FROM sys.dm_os_wait_stats;
GOWAITFOR DELAY '01:00:00';
GOSELECT [wait_type], [waiting_tasks_count], [wait_time_ms],
[max_wait_time_ms], [signal_wait_time_ms]
INTO ##SQLskillsStats2
FROM sys.dm_os_wait_stats;
GOWITH [DiffWaits] AS
(SELECT
-- Waits that weren't in the first snapshot
[ts2].[wait_type],
[ts2].[wait_time_ms],
[ts2].[signal_wait_time_ms],
[ts2].[waiting_tasks_count]
FROM [##SQLskillsStats2] AS [ts2]
LEFT OUTER JOIN [##SQLskillsStats1] AS [ts1]
ON [ts2].[wait_type] = [ts1].[wait_type]
WHERE [ts1].[wait_type] IS NULL
AND [ts2].[wait_time_ms] > 0
UNION
SELECT
-- Diff of waits in both snapshots
[ts2].[wait_type],
[ts2].[wait_time_ms] - [ts1].[wait_time_ms] AS [wait_time_ms],
[ts2].[signal_wait_time_ms] - [ts1].[signal_wait_time_ms] AS [signal_wait_time_ms],
[ts2].[waiting_tasks_count] - [ts1].[waiting_tasks_count] AS [waiting_tasks_count]
FROM [##SQLskillsStats2] AS [ts2]
LEFT OUTER JOIN [##SQLskillsStats1] AS [ts1]
ON [ts2].[wait_type] = [ts1].[wait_type]
WHERE [ts1].[wait_type] IS NOT NULL
AND [ts2].[waiting_tasks_count] - [ts1].[waiting_tasks_count] > 0
AND [ts2].[wait_time_ms] - [ts1].[wait_time_ms] > 0),
[Waits] AS
(SELECT
[wait_type],
[wait_time_ms] / 1000.0 AS [WaitS],
([wait_time_ms] - [signal_wait_time_ms]) / 1000.0 AS [ResourceS],
[signal_wait_time_ms] / 1000.0 AS [SignalS],
[waiting_tasks_count] AS [WaitCount],
100.0 * [wait_time_ms] / SUM ([wait_time_ms]) OVER() AS [Percentage],
ROW_NUMBER() OVER(ORDER BY [wait_time_ms] DESC) AS [RowNum]
FROM [DiffWaits]
WHERE [wait_type] NOT IN (
N'BROKER_EVENTHANDLER', N'BROKER_RECEIVE_WAITFOR',
N'BROKER_TASK_STOP', N'BROKER_TO_FLUSH',
N'BROKER_TRANSMITTER', N'CHECKPOINT_QUEUE',
N'CHKPT', N'CLR_AUTO_EVENT',
N'CLR_MANUAL_EVENT', N'CLR_SEMAPHORE',
N'DBMIRROR_DBM_EVENT', N'DBMIRROR_EVENTS_QUEUE',
N'DBMIRROR_WORKER_QUEUE', N'DBMIRRORING_CMD',
N'DIRTY_PAGE_POLL', N'DISPATCHER_QUEUE_SEMAPHORE',
N'EXECSYNC', N'FSAGENT',
N'FT_IFTS_SCHEDULER_IDLE_WAIT', N'FT_IFTSHC_MUTEX',
N'HADR_CLUSAPI_CALL', N'HADR_FILESTREAM_IOMGR_IOCOMPLETION',
N'HADR_LOGCAPTURE_WAIT', N'HADR_NOTIFICATION_DEQUEUE',
N'HADR_TIMER_TASK', N'HADR_WORK_QUEUE',
N'KSOURCE_WAKEUP', N'LAZYWRITER_SLEEP',
N'LOGMGR_QUEUE', N'ONDEMAND_TASK_QUEUE',
N'PWAIT_ALL_COMPONENTS_INITIALIZED',
N'QDS_PERSIST_TASK_MAIN_LOOP_SLEEP',
N'QDS_CLEANUP_STALE_QUERIES_TASK_MAIN_LOOP_SLEEP',
N'REQUEST_FOR_DEADLOCK_SEARCH', N'RESOURCE_QUEUE',
N'SERVER_IDLE_CHECK', N'SLEEP_BPOOL_FLUSH',
N'SLEEP_DBSTARTUP', N'SLEEP_DCOMSTARTUP',
N'SLEEP_MASTERDBREADY', N'SLEEP_MASTERMDREADY',
N'SLEEP_MASTERUPGRADED', N'SLEEP_MSDBSTARTUP',
N'SLEEP_SYSTEMTASK', N'SLEEP_TASK',
N'SLEEP_TEMPDBSTARTUP', N'SNI_HTTP_ACCEPT',
N'SP_SERVER_DIAGNOSTICS_SLEEP', N'SQLTRACE_BUFFER_FLUSH',
N'SQLTRACE_INCREMENTAL_FLUSH_SLEEP',
N'SQLTRACE_WAIT_ENTRIES', N'WAIT_FOR_RESULTS',
N'WAITFOR', N'WAITFOR_TASKSHUTDOWN',
N'WAIT_XTP_HOST_WAIT', N'WAIT_XTP_OFFLINE_CKPT_NEW_LOG',
N'WAIT_XTP_CKPT_CLOSE', N'XE_DISPATCHER_JOIN',
N'XE_DISPATCHER_WAIT', N'XE_TIMER_EVENT')
)
SELECT
[W1].[wait_type] AS [WaitType],
CAST ([W1].[WaitS] AS DECIMAL (16, 2)) AS [Wait_S],
CAST ([W1].[ResourceS] AS DECIMAL (16, 2)) AS [Resource_S],
CAST ([W1].[SignalS] AS DECIMAL (16, 2)) AS [Signal_S],
[W1].[WaitCount] AS [WaitCount],
CAST ([W1].[Percentage] AS DECIMAL (5, 2)) AS [Percentage],
CAST (([W1].[WaitS] / [W1].[WaitCount]) AS DECIMAL (16, 4)) AS [AvgWait_S],
CAST (([W1].[ResourceS] / [W1].[WaitCount]) AS DECIMAL (16, 4)) AS [AvgRes_S],
CAST (([W1].[SignalS] / [W1].[WaitCount]) AS DECIMAL (16, 4)) AS [AvgSig_S]
FROM [Waits] AS [W1]
INNER JOIN [Waits] AS [W2]
ON [W2].[RowNum] <= [W1].[RowNum]
GROUP BY [W1].[RowNum], [W1].[wait_type], [W1].[WaitS],
[W1].[ResourceS], [W1].[SignalS], [W1].[WaitCount], [W1].[Percentage]
HAVING SUM ([W2].[Percentage]) - [W1].[Percentage] < 95; -- percentage threshold
GO-- Cleanup
IF EXISTS (SELECT * FROM [tempdb].[sys].[objects]
WHERE [name] = N'##SQLskillsStats1')
DROP TABLE [##SQLskillsStats1];IF EXISTS (SELECT * FROM [tempdb].[sys].[objects]
WHERE [name] = N'##SQLskillsStats2')
DROP TABLE [##SQLskillsStats2];
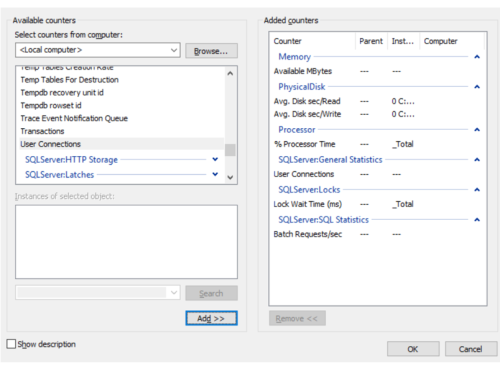
GO1. Set up Performance Monitor (Perfmon). Capture Processor, Avg disk sec/Read (on drive containing data file), Avg. Disk sec/Write (on drive containing tlog file) ,
Lock Wait Time ms, User Connections, Batch per second. (Run during core/busy period)
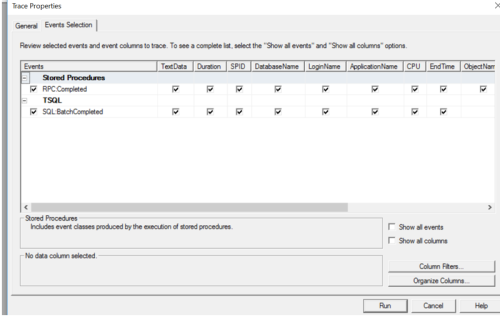
1. Run SQL Profiler. Capture long running / expensive queries. Get the following fields only.
- Text Data
- Duration
- SPID
- DatabaseName
- LoginName
- ApplicationName
- CPU
- EndTime
- ObjectName
- Reads
- RowCounts
- StartTime
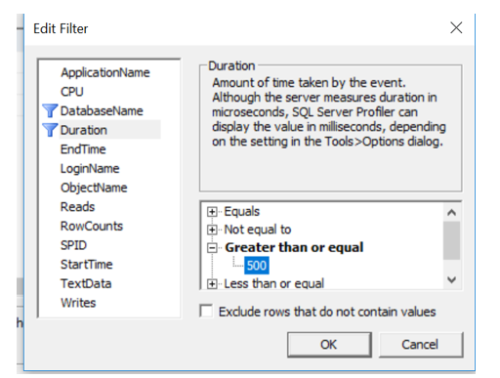
- WritesFilter - Database Name and Duration to more than 500ms.
Or you may choose to capture query performance using Extended Events. Create the extended events using the script below.
(reference: http://sqlconjuror.com/sql-server-capture-long-running-stored-procedures-and-execution-count-using-extended-events/)CREATE EVENT SESSION [QueryPerformance] ON SERVER
ADD EVENT sqlserver.rpc_completed(SET collect_statement=(1)
ACTION(sqlserver.database_name,sqlserver.session_id,sqlserver.sql_text,sqlserver.username)
WHERE ([sqlserver].[equal_i_sql_unicode_string]([sqlserver].[username],N'username') AND [sqlserver].[equal_i_sql_unicode_string]([sqlserver].[database_name],N'DatabaseName') AND [duration]>=(500000))),
ADD EVENT sqlserver.sql_batch_completed(
ACTION(sqlserver.database_name,sqlserver.session_id,sqlserver.sql_text,sqlserver.username)
WHERE ([sqlserver].[equal_i_sql_unicode_string]([sqlserver].[username],N' username ') AND [sqlserver].[equal_i_sql_unicode_string]([sqlserver].[database_name],N'DatabaseName') AND [duration]>=(500000)))
ADD TARGET package0.event_file(SET filename=N'D:\ExtendedEvents\QueryPerformance\QueryPerformance.xel')
WITH (MAX_MEMORY=4096 KB,EVENT_RETENTION_MODE=ALLOW_SINGLE_EVENT_LOSS,MAX_DISPATCH_LATENCY=30 SECONDS,MAX_EVENT_SIZE=0 KB,MEMORY_PARTITION_MODE=NONE,TRACK_CAUSALITY=OFF,STARTUP_STATE=OFF)
GOOnce you have captured the queries via SQL Profiler. Load the output to a table (to a non-prod environment) then
execute query below.SELECT
Object_name,
MIN(st.Duration)/1000 AS MIN_Duration_ms,
AVG(st.Duration)/1000 AS AVG_Duration_ms,
MAX(st.Duration)/1000 AS MAX_Duration_ms,
COUNT(*) AS TotalExecutions
FROM Table_Name AS st
GROUP BY Object_name
ORDER BY AVG(st.Duration) DESC;Below are additional performance tuning techniques that you may find helpful.
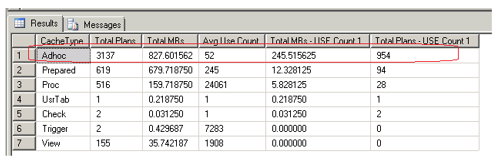
3. Examine Plan Cache Bloat by executing the script below.
SELECT objtype AS [CacheType]
   , count_big(*) AS [Total Plans]
   , sum(cast(size_in_bytes as decimal(18,2)))/1024/1024 AS [Total MBs]
   , avg(usecounts) AS [Avg Use Count]
   , sum(cast((CASE WHEN usecounts = 1 THEN size_in_bytes ELSE 0 END) as decimal(18,2)))/1024/1024 AS [Total MBs - USE Count 1]
   , sum(CASE WHEN usecounts = 1 THEN 1 ELSE 0 END) AS [Total Plans - USE Count 1]
FROM sys.dm_exec_cached_plans
GROUP BY objtype
ORDER BY [Total MBs - USE Count 1] DESC
go
/*
Explanation:SQL Server will look at each query and check if it has a plan cache already compiled for.
If it has, then it will reuse the plan in the cache.
If it does not have, then an execution plan is compiled and added to the plan cache.When identical queries ran over many times, its plan will be reused.
This will save resources from having to compile repeatedly.Now what happens when you have hundreds or thousands of different queries that are only executed once?
In this case there are no execution plan to be reused. This is what we call PLAN CACHE BLOAT.Plan cache bloat is bad because it steals memory from the buffer pool that are better used for database pages
Plan cache bloat can be prevented by enabling “Optimize for Adhoc Workloads” by only caching
the full execution plan of queries that are known to be used more than once.*/
If you see that the number one cache type is “Adhoc”, then prevent it by enabling “Optimize for Adhoc Workloads”
EXEC sp_configure 'show advanced options',1
RECONFIGURE
EXEC sp_configure 'optimize for ad hoc workloads',1
RECONFIGURE
4. Know when was the statistics last updated
-- When were Statistics last updated on all indexes? (Query 55) (Statistics Update)
SELECT o.name AS [Table Name], i.name AS [Index Name],
STATS_DATE(i.[object_id], i.index_id) AS [Statistics Date],
s.auto_created, s.no_recompute, s.user_created, st.row_count
FROM sys.objects AS o WITH (NOLOCK)
INNER JOIN sys.indexes AS i WITH (NOLOCK)
ON o.[object_id] = i.[object_id]
INNER JOIN sys.stats AS s WITH (NOLOCK)
ON i.[object_id] = s.[object_id]
AND i.index_id = s.stats_id
INNER JOIN sys.dm_db_partition_stats AS st WITH (NOLOCK)
ON o.[object_id] = st.[object_id]
AND i.[index_id] = st.[index_id]
WHERE o.[type] = 'U'
ORDER BY STATS_DATE(i.[object_id], i.index_id) DESC OPTION (RECOMPILE);Statistics refers to the statistical information about the distribution of values in one or more columns of a table or an index.
The SQL Server Query Optimizer uses this statistical information to estimate the cardinality, or number of rows, in the query result to be returned,
which enables the SQL Server Query Optimizer to create a high-quality query execution plan -
Not meaning to bring back a dead post, but kind of curious what happened with this?
OP - did you get more memory in the system?The above is all just my opinion on what you should do.
As with all advice you find on a random internet forum - you shouldn't blindly follow it. Always test on a test server to see if there is negative side effects before making changes to live!
I recommend you NEVER run "random code" you found online on any system you care about UNLESS you understand and can verify the code OR you don't care if the code trashes your system.
Viewing 4 posts - 46 through 49 (of 49 total)
You must be logged in to reply to this topic. Login to reply