SQL equivalent to NORM.DIST Excell function?
-
Hi,
I was wondering how I would go about calculating the normal distribution for a number of values, specifically the Probability Density Function.
I know there is a function in Excell that performs this but I need to do this in SQL (I'm trying to create a bell curve graph in SSRS).
Any ideas? I have already seen this article https://dwaincsql.com/2015/05/14/excel-in-t-sql-part-2-the-normal-distribution-norm-dist-density-functions/ but the SQL in this article is way over my head and I don't really understand it.
-
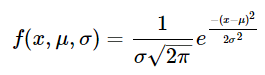
If you know the mean (µ) and variance (sigma²) you can plot a normal p.d.f.

In t-sql the mean is AVG(), the variance is VAR()
It would be helpful if you could provide some data and the results you get in Excel.
-
This is not the purpose of SQL. We are a database language; you really ought to be using a statistical package. You can write out the formula for the normal distribution in SQL, but then you'll have to do all of the floating-point corrections yourself. Having worked as a full-time statistician and having started programming in Fortran, I don't think I could remember how to do all the things I would need to make those corrections. Get the right tool for the job and don't reinvent the wheel.
Please post DDL and follow ANSI/ISO standards when asking for help.
- jcelko212 32090 wrote:
This is not the purpose of SQL. We are a database language; you really ought to be using a statistical package. You can write out the formula for the normal distribution in SQL, but then you'll have to do all of the floating-point corrections yourself. Having worked as a full-time statistician and having started programming in Fortran, I don't think I could remember how to do all the things I would need to make those corrections. Get the right tool for the job and don't reinvent the wheel.
I'm not sure what you mean by "then you'll have to do all of the floating-point corrections yourself"?
-
Back when I was learning Fortran we spent about two weeks on floating-point numbers. Let me give you a simple exercise. Create a list of positive and negative random numbers, over a wide range. Now add them, using a SUM() function. Take the same list and sort it. Add it again. Finally, sort the list from low to high by the absolute value of the numbers. You're almost certainly going to get three different answers bearing in the last decimal place even for a few hundred numbers. This is why floating-point numbers are referred to as an approximate numeric type. You should compare these answers with what you get on a machine that has a bigger word size than your computer. This used to be even worse before the IEEE floating-point standards because each of the vendors had slightly different floating-point implementations. You can get around some of these problems if you know how to properly arrange and compute expressions with floating-point numbers. Or if you're using a package that was designed to work with them.
Please post DDL and follow ANSI/ISO standards when asking for help.
-
I know that floating-point numbers are approximate. The errors you are referring to would only apply to the least significant digits of the result. But all the OP wants to do is plot a line in SSRS so I can't see how this matters or that they would have to correct anything.
-
Standard deviation is the square root of the variance
Aus dem Paradies, das Cantor uns geschaffen, soll uns niemand vertreiben können
-
It is not just rounding in a single computation. When you have a set of floats, you also get skew in the set as a whole, either away from or toward zero.
Please post DDL and follow ANSI/ISO standards when asking for help.
- mharbuz wrote:
I was wondering how I would go about calculating the normal distribution for a number of values, specifically the Probability Density Function.
How many data points and over what interval do you need?
Aus dem Paradies, das Cantor uns geschaffen, soll uns niemand vertreiben können
- jcelko212 32090 wrote:
It is not just rounding in a single computation. When you have a set of floats, you also get skew in the set as a whole, either away from or toward zero.
The main problems using floating points occur if you add or subtract a large number to a small number as part of the calculation, the small number can be totally lost or its precision reduced. The calculation for normal p.d.f. doesn't involve this. The precision of SQL's floating-point is up to 15 digits which I think is more than enough to maintain the accuracy the OP requires.
-
Thank you all for the replys.
I was away yesterday so couldn't reply to any of you. I have posted a similar thread in the SSRS forum but only got one reply that wasn't overly helpful so I thought I'd try here.
I work for a solicitors and management basically want a report with a bell curve that shows the average time we spend on certain matters, so for example we could have 5 matters where we spend 1 hour, 10 matters that took 2 hours, 11 matters that took 3 hours, etc.
I have a query that can show all this in a line graph in SSRS but they want the data displayed in a bell curve so they can find the "sweet spot" for the amount of time it takes to complete certain matters.
In terms of having approximate figures I really don't mind, the whole point management want a bell curve is to display an approximate average/trend.
Jonathan (or anyone else for that matter) if you still want me to provide some data and/or results I get in Excell or the SQL I use to get the data then just let me know 🙂
- mharbuz wrote:
if you still want me to provide some data and/or results I get in Excell or the SQL I use to get the data then just let me know 🙂
Yes, post some data.
SQL will only be able to return a list of (x, y) points for the curve. You'll have to get SSRS to plot the curve from these points. So it would be helpful if you could also specify the output you want from the input.
- Jonathan AC Roberts wrote:
Yes, post some data.
SQL will only be able to return a list of (x, y) points for the curve. You'll have to get SSRS to plot the curve from these points. So it would be helpful if you could also specify the output you want from the input.
OK, the SQL I used to get the data is
select casetype, mattersarchive.description, TimeRecordedBalance / 3200 as Time
from mattersarchive inner join casetypes on mattersarchive.CaseType = CaseTypes.Description
where casetype not like 'domestic %' and mattersarchive.created > '2013-07-01' and mattersarchive.description LIKE '%' + @Description + '%'
Time is recorded in seconds so I divide it by 3200 to get it in hours, I also select casetype and description because I want to have interactive filters in SSRS to filter matters based on the case type and description.
I have then typed out my results into Excell, at first I grouped my data into "Time" and "Amount" columns and then made another column called "Data" that just had the raw ungrouped data. I then worked out the Mean average and standard deviation for the data, then I used NORM.DIST to work out the Normal Distribution for each data entry. Then I just created a scatter graph from the "data" and "distribution" column to create a bell curve.
Excell file is attached, I used this page for guidence: https://www.extendoffice.com/documents/excel/2404-excel-template-bell-curve-chart.html
I basically want to recreate this graph in SSRS, I can work out the average and standard deviation in the SQL but I'm struggleing to work out the normal distribution.
-
You can write a Table Valued Function (tvf) as in the article you posted, I believe this may be more efficient than a scalar-valued function:
IF OBJECT_ID(N'dbo.tvfNORMALDIST', N'IF') IS NULL
    EXEC ('CREATE FUNCTION dbo.tvfNORMALDIST() RETURNS TABLE RETURN SELECT NULL X')
GO
ALTER FUNCTION dbo.tvfNORMALDIST
(
    @x        float,      -- x coordinate
    @Mean     float,      -- Mean of the data
    @Variance float       -- Variance of the data
)
RETURNS TABLE WITH SCHEMABINDING
RETURN
SELECT EXP(-POWER(@x-@Mean,2)/(2*@Variance))/(SQRT(2*PI()*@Variance))  Y
GO
Alternatively you could create a scalar-valued function which will do the same job:
IF OBJECT_ID(N'dbo.fnNORMALDIST', N'FN') IS NULL
     EXEC ('CREATE FUNCTION [dbo].[fnNORMALDIST] () RETURNS varchar(1) AS BEGIN RETURN ''X'' END')
GO
ALTER FUNCTION dbo.fnNORMALDIST
(
    @x        float,      -- x coordinate
    @Mean     float,      -- Mean of the data
    @Variance float       -- Variance of the data
)
RETURNS float AS
BEGIN
    RETURN  EXP(-POWER(@x-@Mean,2)/(2*@Variance))/(SQRT(2*PI()*@Variance))
END
GO
Here is some SQL to simulate the results from your query to get the times:
IF OBJECT_ID('tempdb..#Data','U') IS NOT NULL
    DROP TABLE #Data
GO
;WITH Data AS (SELECT * FROM (VALUES
(0),(0),(0),(0),(0),(0),(0),(0),(0),(0),(1),(2),(2),(2),(3),(3),(3),(3),(4),(4),(4),(5),(5),(5),(6),(6),(6),(6),
(7),(7),(7),(7),(7),(7),(7),(8),(8),(8),(8),(8),(8),(8),(9),(9),(9),(9),(9),(9),(9),(9),(9),(10),(10),(10),(10),
(10),(10),(10),(10),(10),(10),(10),(10),(10),(11),(11),(11),(11),(11),(11),(11),(11),(11),(12),(12),(12),(12),(12),
(13),(13),(13),(13),(13),(14),(14),(14),(14),(14),(14),(14),(14),(14),(14),(15),(15),(15),(16),(16),(16),
(17),(17),(17),(18),(18),(19),(19),(20),(20),(20),(20),(20),(20),(20),(21),(22),(22),(23),(23),(23),(24),
(25),(25),(25),(26),(26),(27),(27),(28),(28),(29),(30),(30),(30),(31),(31),(32),(34),(35),(35),(36),(51)) T(Time))
SELECT *
  INTO #Data
  FROM Data
GO
SELECT * FROM #Data
GO
Then all you need to do is call the function with an X value you want to plot, the Mean and Variance from your data:
Table valued function: tvfNormalDist
-- Table valued function
SELECT *
  FROM dbo.Tally t
 CROSS APPLY (SELECT AVG(Time+0.0), VAR(Time) FROM #Data) X(Mean, Variance)
 CROSS APPLY dbo.tvfNORMALDIST(T.N, X.Mean, X.Variance) Y
 WHERE t.N BETWEEN 1 AND 60
GO
Scalar-valued function: fnNormalDist
-- Scalar valued function
SELECT *,
       dbo.fnNORMALDIST(T.n, x.Mean, x.Variance) Y
  FROM dbo.Tally t
 CROSS APPLY (SELECT AVG(Time+0.0), VAR(Time) FROM #Data) X(Mean, Variance)
 WHERE t.N BETWEEN 1 AND 60
GO
Or you can do it without any function at all just by coding the formula within your query:
No function
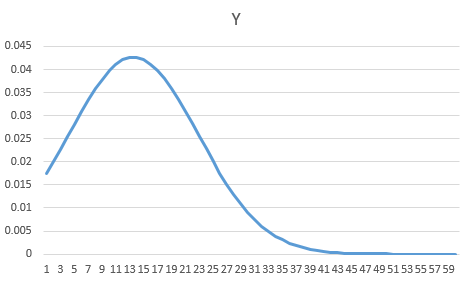
SELECT *,
       EXP(-POWER(T.n-x.Mean,2)/(2*x.Variance))/(SQRT(2*PI()*x.Variance))  Y
  FROM dbo.Tally t
 CROSS APPLY (SELECT AVG(Time+0.0), VAR(Time) FROM #Data) X(Mean, Variance)
 WHERE t.N BETWEEN 1 AND 60
GO
If I paste the results into Excel and plot a chart I get this:
Viewing 15 posts - 1 through 15 (of 19 total)
You must be logged in to reply to this topic. Login to reply