Server not caching any plans
-
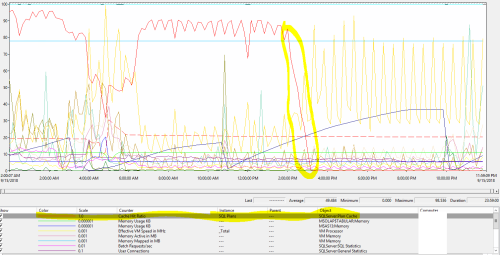
So I know memory pressure can cause SQL Server to push plans out of the plan cache but this is a bit extreme. A very active SQL 2016 SQL Server has gone from working just fine with an average cache hit ratio around 90% to a ratio of 0.
Buffer cache hit ratios stay high averaging close to 100% and the server is using 35.8 out of it's capped 38 GB of memory but for some reason the plan cache is empty. Effect is noticed by our end users when processes that usually run in 2 hours suddenly start taking 4 and on the server the avg % CPU time goes from about 10 up to 25. Under normal operation the plan cache will hold 30k+ queries but any time you query sys.dm_exec_cached_plans when this condition exists it might hold 10 queries and they're gone the next time you query the DMV. Nothing stays in the cache for more than a few seconds.
DBCC PROCCACHE returns this:
num proc buffs num proc buffs used num proc buffs active proc cache size proc cache used proc cache active
729980 20 20 7 2 2
and changes every time you run it but the numbers always stay very low.It very clearly happens during a 1 hour window where the cache hit ratio drops from 90 to nothin'. There's nothing in the SQL Server error logs during that window, no scheduled tasks were running then that normally aren't. It just quit caching queries and doesn't recover until restarting the service.

Any ideas?Kris Hokanson
-
It sure looks like additional processing is occurring. See the VM processor going up at exactly the same point as your memory issues start. You also see that earlier with the other dip. Based on the fact that it's associated with a VM, is it possible you're dealing with some kind of resource contention there? I might not be your machine at all, but another virtual machine on the same physical box. Additional counters that might help you pin the problem down would be:
Memory: Available MBytes, Pages/sec
SQL Server Memory Manager: Memory Grants Pending, Target Server Memory
Process: Private BytesIf you're seeing Available MBytes drop, you may be experiencing external memory pressure.
Use DBCC MEMORYSTATUS and look to see if COMMITTED is above TARGET. If so, you have internal memory pressure. Look at sys.dm_os_memory_brokers to see what's using everything.
If Private Bytes is high look to sys.dm_os_memory_clerks to see what's going on. However, this is unlikely in your scenario since the memory pressure is clearly on buffer.
I hope this helps.
"The credit belongs to the man who is actually in the arena, whose face is marred by dust and sweat and blood"
- Theodore RooseveltAuthor of:
SQL Server Execution Plans
SQL Server Query Performance Tuning -
Thanks for the pointers Grant.
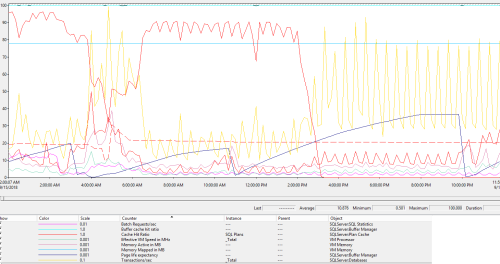
Memory: Available MB was already being collected and is represented by the dashed red line that stays steady at about 20 GB. The line that clearly goes up isn't VM processor it's actually SQL Server: Databases Transactions/Sec. The Effective VM Speed and % Proc time actually only go up about 10% but it's enough to significantly slow down certain processes.
The server admin went ahead and did a reboot so it's working much better for now. That being said I went ahead and added SQL Server Memory Manager: Memory Grants Pending and Memory: Pages/Sec. We cap the SQL Server service at 40 GB and that's the number that's seems to be fixed in Target Server Memory and Private Bytes so figured they might not add much to the picture in this case.
The big thing that stumps me is that no matter how long we wait, the query engine never starts caching queries again but given a restart things work fine. Usually if it's another system consuming resources, that will eventually subside and things will start working fine again. Also, even after this issue starts, the Buffer Manager cache hit ratio and PLE are unaffected. If the PLE is in the 10k+ range and buffer cache hit ratio over 99%, wouldn't SQL Server free memory there before shrinking the plan cache to 0?
If and when this problem crops back up I'll try to collect more of the info you pointed to and see where that takes us. Here's a slightly cleaned up screenie of what was going on:
Again, thank you for taking the time to provide some input on this.
Kris
-
Obviously you want to get to the root of the issue that is causing the sudden spike but I might recommend looking into buffer pool extension if you have a spare SSD on the box.
Viewing 4 posts - 1 through 4 (of 4 total)
You must be logged in to reply to this topic. Login to reply