Rolling back SELECT query took hours, used high CPU and very low disk. I couldn't see why.
-
A user ran the below command against one of our production servers (table name and ID value substituted). This is the complete problem query.
SELECT DATA.ID
FROM (
  SELECT 123456 AS ID
  UNION ALL SELECT 123457
 ... another 1000000 rows of the above UNION ALL SELECT <ID>...
) AS DATA
WHERE NOT EXISTS (
 SELECT *
 FROM TABLE1
 WHERE TABLE1.ID = DATA.ID
)
This ran for two hours, then, after consulting with the user, I ran a KILL against the session's ID ago. After six further hours it was still rolling back (Task state was KILLED/ROLLBACK) and I restarted the SQL Server service to resolve the issue. I expected it to end the SELECT query after a few seconds at most, and I couldn't see why.
I'd like to be able to learn from this situation. I could really do with someone looking at what I've found, and pointing out where I could have better investigated to find what's going on.
Here's the results of my investigation:
The SQL Server instance is very low on memory
I read from the Perfmon counter SQLServer:Memory Manager:Free Memory (KB) that memory is nearly at full-use (it was varying between 40,000KB and 18,000KB free). I think that's a key.
There was no paging happening (Perfmon counter Memory : Pages/sec sits at 0), I think because it had hit SQL Server's Max Memory of 12,000[MB].
The virtual machine has 16GB of memory attached.This server is in a VMWare virtual machine, I could have perhaps ask for more memory to be hot-added to the box, but not in-time for the next loading window. I could have increased SQL's Max Memory to 14GB, which SQL would use, but that would only leave 2GB for Windows, causing the OS to page to disk.
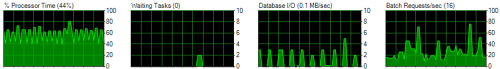
CPU usage was high, but has a saw shape.
sp_WhoIsActive showed the CPU increasing at a rate of approximately 83000 [milliseconds] per minute and using 200MB of memory.
Activity Monitor showed CPU between 40% and 70%. The shape of that processor time graph looks saw-like, but I don't know what to make of that - the CPU pressure was not consistent, but I don't know what to infer from that.
The VM has two physical CPUs, 4 logical cores, running at 2.4Ghz.
This query did no reads/writes, and had no open transactions
sp_WhoIsActive showed 0 reads,writes and physical reads for this query
sp_WhoIsActive showed 0 open transactions and 0 tempdb allocations
sp_WhoIsActive showed the status as runnable
sp_WhoIsActive showed no other running tasks (besides the occasional operational query, which completed without issue)Other queries were (thankfully!) not blocked by this statement
This table is loaded nightly, so this query didn't block INSERT/UPDATEs, allowing users to continue as normal during the workday (with a slower SQL server).There were no concerning waits
I didn't see any significant waits in sys.dm_os_waiting_tasks over 60 seconds
This probably wasn't an I/O issue
Activity Monitor Data File I/O Response Times were <= 10ms, except tempdb, which jumped up to 450-500ms on occasion.
There were no problem latch waits, which I'd expect for an I/O issue.I could not get an estimated query plan
This may have been a non-optimal thing to have done; I tried to get an estimated query plan to see if that would yield more information after five hours waiting. It waited on a RESOURCE_SEMAPHORE_QUERY_COMPILE wait, and I stopped it after approximately 30 seconds.No data was manipulated by the problem query
There were no open transaction or data written/read from disk by the query, so this problem query didn't have any hostages. Restarting the SQL Server service seemed a reasonable choice to resolve the issue without further incident.My diagnosis
The low memory issue had prevented this query from running, and caused problems killing it. This query did no data manipulation, so restarting the SQL Server service to resolve the problem before the following loading window was a reasonable course of action.Again, I'd really appreciate advice on how I could have investigated this better, any insight as to what what was going on during the six hours it took for this statement to die, and/or whether the solution I chose - restarting the SQL Server service - was reasonable, given the situation.
Andrew P.
-
I've restarted the SQL Server service, which resolved the issue.
I'd love to hear any suggestions on what I could have done differently to diagnose why the kill command wasn't able to quickly kill the session, or what you think could have caused this.
Andrew
-
What about tempdb, looks to me like that could be part of the problem.
😎

Viewing 3 posts - 1 through 3 (of 3 total)
You must be logged in to reply to this topic. Login to reply