Replication and Deadlocks at subscriber
-
Hello friends, and happy TurkeyDay,
I have a database used for reporting, a subscriber, that occasionally has mismatch records, and I'm trying to find out why. Why they keep getting out of synch.
Setup:
Both Publisher and Subscribers: SQL2016 SP2 CU15. Windows Server 2019. Same datacenter, same subnet, so nothing too complex
Distributor in the same server as Publisher. Push Subscriptions. jobs [Agent history clean up: distribution] and [Distribution clean up: distribution] enabled and running with the default values
There are several Transactional Publications on the main database, but nothing overlapping, and all point to the subscriber.
The subscriber's tables are only written by replication, and each table has only one subscription (so no convergence replication or merge replication)
What I've done
About once a day I run a count on a particular table, and the counts are off, so then I ran tablediff.exe and shows a lot of mismatch rows.. anywhere from a couple dozen to a few hundreds.
I checked the latency, and it look good, only a few seconds, at that time. However in times of high Publisher activity it can climb up to 20 mins, but it eventually catches up. After those spots of latency, tablediff shows no difference so it's not happening then.
I inserted a tracer token and it looks good. There are no errors on neither of the jobs, replication monitor, etc.
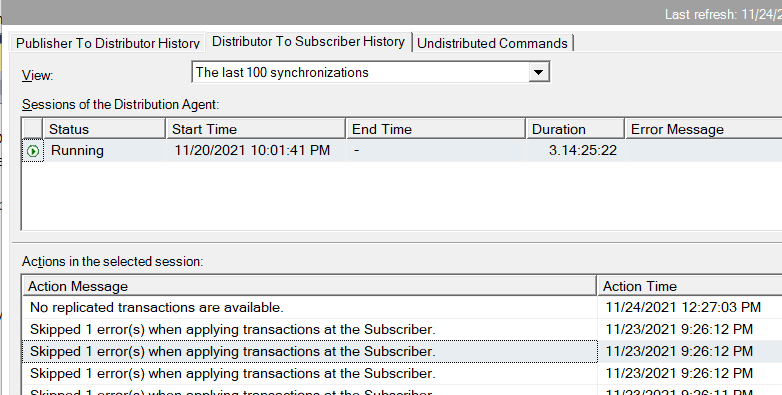
The Distribution Agent history, "Distributor to Subscriber History section" shows "Skipped X error(s) when applying transaction a the subscriber"

The "view sync status" section keep showing no errors, most of the time "no transaction available"
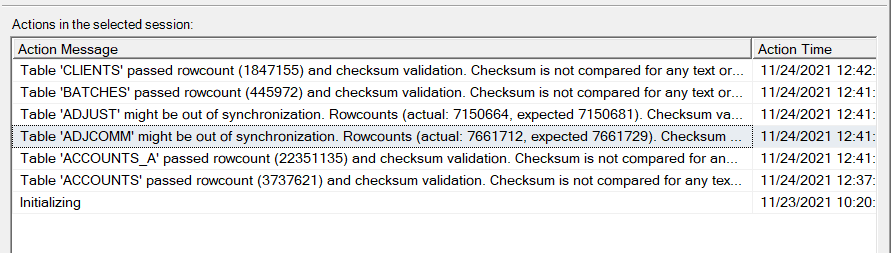
If I try to validate the subscriptions, it shows me that might be out of synch:
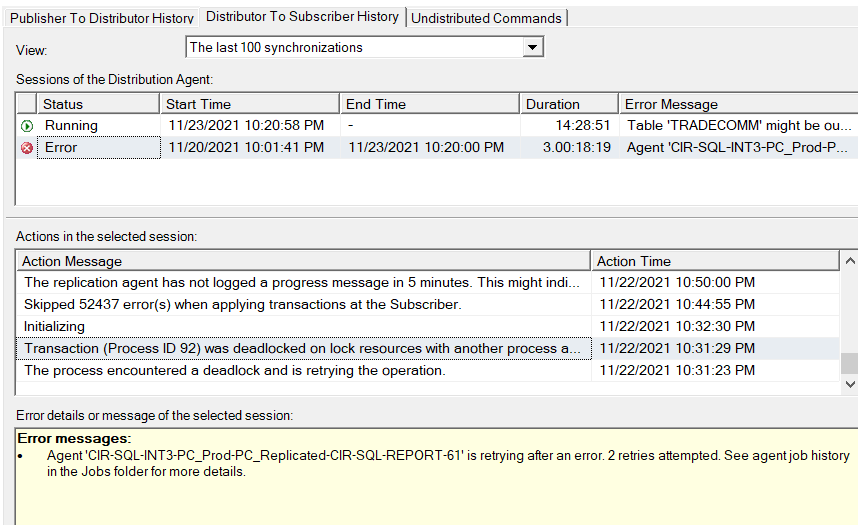
The only thing I can find is a deadlock on the subscriber. Our SQLSentry thing only captures long running deadlocks so I'm sure there are more, and that's the cause of my problem, but I still don't know how to prevent it.
Sometimes I'm able to capture it like this:
The Read Committed Snapshot Isolation setting is set to FALSE on both Publisher and Subscriber. So I changed the RCSI to true in the subscriber but I still got deadlocks.
What I need
First to all, I need to figure out how I can stop getting deadlocks and mismatch data. I mean, I eventually run the output of tablediff to sync the tables, and occasionally I just re-ran the snapshot, but I keep having the issue.
I figure I could improve performance and look at this article:
https://red9.com/blog/performance-tune-sql-server-replication-checklist/
but before start tweaking, I would like to measure performance, so I can tell if any changes I make do things better (other than presence/absence of deadlocks.
Too many websites about how to fix Replication when it doesn't work at all, but can someone point me to a URL where I can learn what to measure on Replication?
Thank you ALL
Miguel
-
Thanks for posting your issue and hopefully someone will answer soon.
This is an automated bump to increase visibility of your question.
-
I can't speak to all of this as I don't use replication and haven't set it up or seen that problem before, but I am curious what you mean by "Our SQLSentry thing only captures long running deadlocks so I'm sure there are more, and that's the cause of my problem". Deadlocks are either "yes" or "no"... I am not aware of anything like a "long running deadlock". Either a deadlock happened and something was rolled back, or it didn't happen and nothing was rolled back. I am not sure what a "long running deadlock" is.
And SQL should just retry the query after the deadlock as it indicates in the error message. Although you may want to check the error log in the job folder as indicated in that error. If it fails multiple times, it is probably something you should investigate.
Plus, since you have SQL Sentry, might as well explore the deadlock graphs in there. See what caused the deadlock and see if the replication actually retried successfully, or if those got stuck and unprocessed.
The above is all just my opinion on what you should do.
As with all advice you find on a random internet forum - you shouldn't blindly follow it. Always test on a test server to see if there is negative side effects before making changes to live!
I recommend you NEVER run "random code" you found online on any system you care about UNLESS you understand and can verify the code OR you don't care if the code trashes your system. -
Thank you for your reply. Gosh, no matter how thorough I try to be, there are always things that slip through.
Yeah, there are no such a thing as "long running deadlock". I meant to say "long running locks that result in deadlocks".
SQLSentry captured some deadlocks, but only one or two, and that would not explain the frequency and prevalence of the problem.
And the pretty graph only tell me that "there was a deadlock with replication" but that I already know.
Are you saying that the Distributor Agent should see if there are errors (deadlocks) it should retry?
I dont see how to configure that. I only can find under distribution properties "continue on consistency errors" and that's it
Thank you for your time
-
I was just reading the error message as it says "The process encountered a deadlock and is retrying". This is the expected behavior.
Now, as for long running blocking causing deadlocks, that's not exactly how deadlocks work. You could have a query blocked for a week and it might not deadlock. A deadlock occurs when 2 queries block each other and neither will EVER complete. In this scenario, one of them must be killed. If query A doesn't block query B, SQL assumes that query A will eventually complete. You can test this pretty easily by starting a transaction, doing an insert into a table and not committing the transaction THEN doing another insert into the same table that would result in the same page being updated. For example, if you have an empty table and do an insert in query window 1 inside a non-committed transaction, then do an insert in query window 2 into the same empty table. Query 2 will wait for query 1 to be committed or rolled back before it will complete. But no matter how long you wait, it will NOT deadlock.
SQL Sentry only seeing a small number of deadlocks means that you only have a small number of deadlocks.
What I expect is happening (I cannot see your system or logs or the activity on any of the systems) is that replication is working as expected and things are just out of sync due to delays in replication.
Now, with the deadlock graph, you say it only tells you there is a deadlock with replication - replication shouldn't be deadlocking itself; this should be nearly impossible to happen. I expect there is more to it than replication deadlocking itself and that the problem may be either a trigger on the subscriber that is deadlocking, the subscriber trying to pull data in multiple times at once resulting in 2 subscriber syncs running at the same time and deadlocking each other, or something is misconfigured. The "skipped xxx errors" lines make me think either multiple subscriptions or subscription firing twice or misconfiguration. BUT I would check the logs. "skipped 1 error(s)" SHOULD show up in a log somewhere.
Also, (again, I've not set up replication before), is it normal for the session to run for days like that? I would expect that a session would start, push the data across, and close and a new session would start to push across the next round of data. I am just thinking of Service Broker in which starting a conversation is a slow operation so you should try to reuse them BUT a long running conversation can have performance issues too, so restarting conversations is recommended.
As for measuring performance, the logs would be one way, extended events would be another, perfmon could be yet another. It depends entirely on what you are trying to monitor. It's like asking how to measure SQL Server performance. Are you talking about query performance, disk I/O, CPU, memory, network I/O, etc. And even with query performance, are you talking about execution plan, query duration, or logical reads?
The above is all just my opinion on what you should do.
As with all advice you find on a random internet forum - you shouldn't blindly follow it. Always test on a test server to see if there is negative side effects before making changes to live!
I recommend you NEVER run "random code" you found online on any system you care about UNLESS you understand and can verify the code OR you don't care if the code trashes your system.
Viewing 5 posts - 1 through 5 (of 5 total)
You must be logged in to reply to this topic. Login to reply