Moving sub-columns in a tablix
-
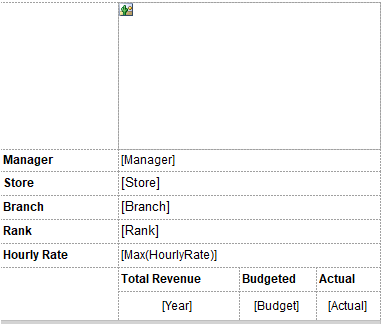
I have a report which looks like this:

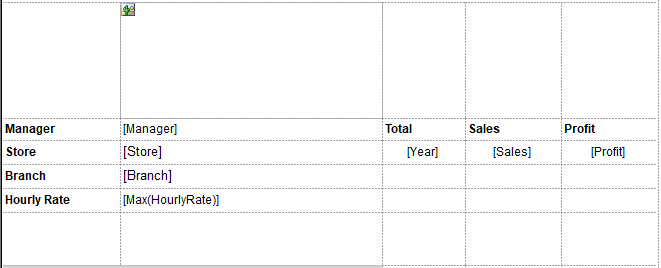
These are all grouped by manager, with each of the center cells displaying the value for the particular manager and then the picture at the top and at the bottom right the sales and profit for each year. This repeats for each manager. I want to move the bottom right sub-columns so that they display to the right of the picture or the center cells. However when I've tried to create new columns and copy and paste these there like this:
only one year is displayed rather than all of them. What am I doing wrong?
-
Okay, to start, you're not grouping by year because you are putting the year in the same row as the other groups... you probably need a matrix instead of a tablix.
Steve (aka sgmunson) 🙂 🙂 🙂
Rent Servers for Income (picks and shovels strategy) -
But even when I keep it in the same row as in the first one but move it to a new column to the right, it only displays one year and not all 4 like in the first result.
-
I was able to get it to work by creating a separate table off to the right grouping and sorting by the same field(manager). However, it is not aligning with the data points from the first table. Is there a way to have manager in the first table align with total for each manager?
-
As I said before, you need a matrix and not a tablix. However, you can effectively turn the tablix into a matrix by adding a column group. The year would be the column to group on, then the sales and profit numbers would be summarized values for each year.
Steve (aka sgmunson) 🙂 🙂 🙂
Rent Servers for Income (picks and shovels strategy) -
A column group does not give the result I am looking for. What I am looking for is where next to each manager, store, branch and hourly rate, there are three columns, each displaying the sales and profit for a different year. And this would repeat for each manager: to the left their individual values for the fields specified and then to the right the sales and profit by year table. I am able to achieve this by creating a separate table with those columns grouped and sorted by manager, but the issue I am running into is that as you go down the list of managers the alignment between the two tables goes out of synch. Is there a way to fix this?
-
Otherwise, is there is way to make it so that the year rows on the left appear directly next to the manager, store, branch and hourly rate? When I create a row group by year, it can only appear within one of the rows on the left. I need each year to appear in a separate row. Is this possible?
-
Not in a tablix... You MUST use a matrix to do this. Grouping by Year as a "row group", and then your other groups would need to be "column groups". It doesn't really matter which group of groups is which... so long as... if year is in the "column groups", then the other groups are all "row groups", or vice versa. It's just not going to happen in a tablix. Are you familiar with the difference between a tablix and a matrix in SSRS ? If not, do some google searches on that.
Steve (aka sgmunson) 🙂 🙂 🙂
Rent Servers for Income (picks and shovels strategy)
Viewing 8 posts - 1 through 8 (of 8 total)
You must be logged in to reply to this topic. Login to reply