how to write this query?
-
hi everyone
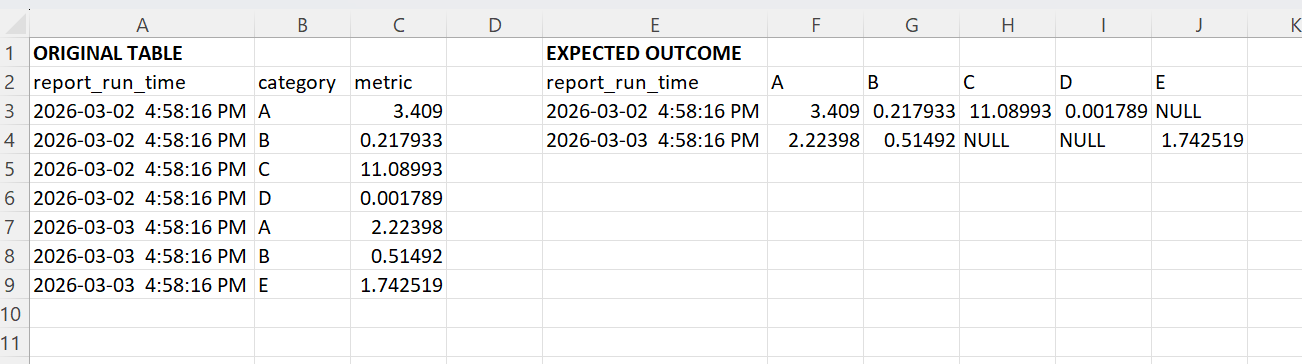
I am not sure how to write the query that will produce the expected results. Basically, I need to convert data found in columns and put them into rows. I have provided sample data and screenshot of expected result. Can someone please help me with this?
Thank you
Sample Data
drop table if exists #temp1

create table #temp1
(
report_run_time datetime not null,
category varchar(50) null,
metric float null
)

insert into #temp1
values  ('2026-03-02 16:58:16.393', 'A','3.409'),
('2026-03-02 16:58:16.393', 'B','0.217933'),
('2026-03-02 16:58:16.393', 'C','11.08993'),
('2026-03-02 16:58:16.393', 'D','0.001789'),
('2026-03-03 16:58:16.393', 'A','2.22398'),
('2026-03-03 16:58:16.393', 'B','0.51492'),
('2026-03-03 16:58:16.393', 'E','1.742519374')

select *
from #temp1
Expected Outcome

-
One thing I should mention is regarding the categories. Most of the time when the report is run it produces the same set of categories. However, it is possible that a new category can be added or old one removed. That is why the test data has such cases. I don't want to manually track addition/removal of categories so ideally the query should handle it.
-
You need a dynamic crosstab query to handle the variability in categories. This should get you going:
https://www.sqlservercentral.com/articles/cross-tabs-and-pivots-part-2-dynamic-cross-tabs
Viewing 3 posts - 1 through 3 (of 3 total)
You must be logged in to reply to this topic. Login to reply