How to check database deadlock and blocked process occurred before?
-
1. if there is no database monitoring software, and if there is any approach to check the database deadlock and blocked process occurred before?
and how to know which statement caused the dead lock and which statment was blocked?
2. if use the third part monitoring software, which one is the best to do that ?
Thanks!
-
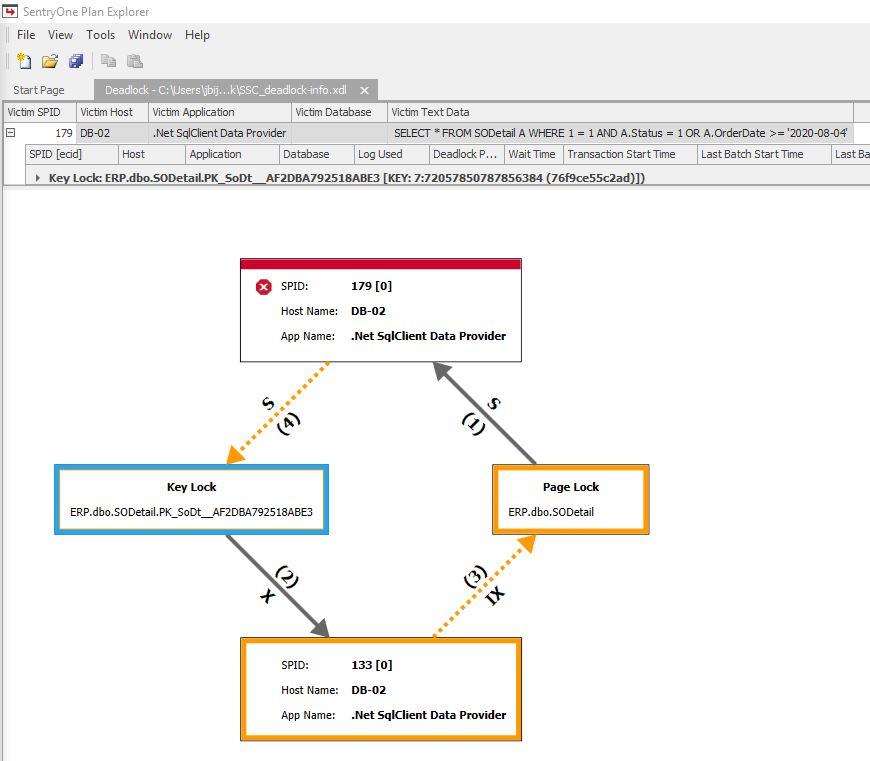
for a start, maybe use sentryone plan explorer (free) to replay the exported deadlock xml
Johan
Learn to play, play to learn !Dont drive faster than your guardian angel can fly ...
but keeping both feet on the ground wont get you anywhere :w00t:- How to post Performance Problems
- How to post data and code to get the best help- How to prevent a sore throat after hours of presenting ppt
press F1 for solution, press shift+F1 for urgent solution 😀
Who am I ? Sometimes this is me but most of the time this is me
-
- For deadlocks you can look into the system_health Extended Event session to find more occurrences. I have an example query here on this blog post on AWS RDS. This will work the same way on any SQL Server instance running 2012 or greater. Blocked processes are tougher. Unless you're specifically capturing the blocked process report, there's not a way. However, you can see queries that had long wait times (>30 seconds) in system_health. That could help. Here's a blog post on that. To really solve this issue, put together monitoring, or buy it.
- This one is really subject to opinion and evaluation. My employer makes one of the top rated, and I think the best, monitoring tools, SQL Monitor.
"The credit belongs to the man who is actually in the arena, whose face is marred by dust and sweat and blood"
- Theodore RooseveltAuthor of:
SQL Server Execution Plans
SQL Server Query Performance Tuning - Grant Fritchey wrote:
- <li style="list-style-type: none;">
- For deadlocks you can look into the system_health Extended Event session to find more occurrences. I have an example query here on this blog post on AWS RDS. This will work the same way on any SQL Server instance running 2012 or greater. Blocked processes are tougher. Unless you're specifically capturing the blocked process report, there's not a way. However, you can see queries that had long wait times (>30 seconds) in system_health. That could help. Here's a blog post on that. To really solve this issue, put together monitoring, or buy it.
- <li style="list-style-type: none;">
- This one is really subject to opinion and evaluation. My employer makes one of the top rated, and I think the best, monitoring tools, SQL Monitor.
Thank you Grant Fritchey!
I don't have Web Service RDS, but I ran below SQL Statement on local SQL Server and got information as the file.
SELECT dl.deadlockgraph
FROM
(
SELECT dl.query('.') AS deadlockgraph
FROM fxd
CROSS APPLY event_data.nodes('(/event/data/value/deadlock)') AS d(dl)
) AS dl;
in the deadlock info file, per this information, does it mean process ID process4067304cf8 blocked by process ID process4068905c38?
and process4067304cf8 became a victim process4068905c38 ran successfully ? thanks!
- 892717952 wrote:
Thank you Grant Fritchey!
I don't have Web Service RDS, but I ran below SQL Statement on local SQL Server and got information as the file.
SELECT dl.deadlockgraph
FROM
(
SELECT dl.query('.') AS deadlockgraph
FROM fxd
CROSS APPLY event_data.nodes('(/event/data/value/deadlock)') AS d(dl)
) AS dl;
in the deadlock info file, per this information, does it mean process ID process4067304cf8 blocked by process ID process4068905c38?
and process4067304cf8 became a victim process4068905c38 ran successfully ? thanks!
Right at the top:
<victimProcess id="process4067304cf8" />
That's the victim process. It was rolled back. The other one succeeded.
"The credit belongs to the man who is actually in the arena, whose face is marred by dust and sweat and blood"
- Theodore RooseveltAuthor of:
SQL Server Execution Plans
SQL Server Query Performance Tuning -

Johan
Learn to play, play to learn !Dont drive faster than your guardian angel can fly ...
but keeping both feet on the ground wont get you anywhere :w00t:- How to post Performance Problems
- How to post data and code to get the best help- How to prevent a sore throat after hours of presenting ppt
press F1 for solution, press shift+F1 for urgent solution 😀
Who am I ? Sometimes this is me but most of the time this is me
- Grant Fritchey wrote:892717952 wrote:
Thank you Grant Fritchey!
I don't have Web Service RDS, but I ran below SQL Statement on local SQL Server and got information as the file.
SELECT dl.deadlockgraph
FROM
(
SELECT dl.query('.') AS deadlockgraph
FROM fxd
CROSS APPLY event_data.nodes('(/event/data/value/deadlock)') AS d(dl)
) AS dl;
in the deadlock info file, per this information, does it mean process ID process4067304cf8 blocked by process ID process4068905c38?
and process4067304cf8 became a victim process4068905c38 ran successfully ? thanks!
Right at the top:
<victimProcess id="process4067304cf8" />
That's the victim process. It was rolled back. The other one succeeded.
noted, thank you Grant Fritchey!
Viewing 7 posts - 1 through 7 (of 7 total)
You must be logged in to reply to this topic. Login to reply