how to capture query response times ?
-
Hi All,
We have sql server instance running on a VM which hosts 5 small dbs. Now they wanted to move those database to sql azure managed instance.
There is one important application database called "CDP" and it used heavily by the application team, now they are very particular about the response times of the queries, even after moving to Azure platform. As a proactive measure we as part of dba team, wanted to run some kind of light weight trace/extended event/serverside trace to capture the response times of the queries which are run against that specific database "CDP". Is this a good idea ? Secondly, question is how to capture the response time(s) of each n every query run against the database using extended event session. Thirdly, do we need to run a continuous trace or is there a better way to accomplish this?
Another question I have in my mind, do we need to actually go back to app team and check is there any specific queries to be monitored or each n every query to be captured?
Would like to know , what relevant questions do we need to really ask before going for migration in order to get predictive query performance.
Current SQL Server Version :
Microsoft SQL Server 2016 (SP2) Developer Edition (64-bit) on Windows Server 2016 Datacenter 10.0 <X64> (Build 14393: ) (Hypervisor)
Regards,
Sam
-
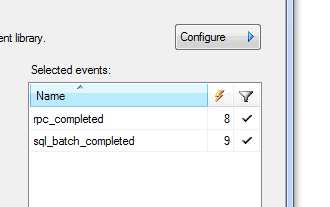
The best tool for the job, if you want detailed query behaviors, is Extended Events. They are the least cost way to gather detailed query metrics. You only really need to capture two events, rpc_completed and sql_batch_completed. Those do everything you need. Now, another mechanism, that is also very lightweight, but not detailed, is to use the Query Store. There you'll get aggregate behaviors (grouped by hour out of the box, but this can be adjusted). This a great way to capture metrics when moment-by-moment details are not needed.
If you capture all the executions of all the queries, be prepared to handle the amount of data that entails. Be sure you capture the metrics to disk, but, not to the C:\ drive and not to the same disk that is storing your logs and/or data (or tempdb for that matter). You want to do this in a way that interferes as little as possible with standard operations.
To get started with Extended Events, you can't go wrong using the Microsoft documentation. I have a bunch of blog posts on the topic and a few videos. If you really want a lot of detail on how to use Extended Events in support of query tuning, then I recommend getting a copy of my book on the topic, linked below.
That's how to understand, the best way possible, how your queries are behaving. In addition, I'd be monitoring the wait statistics on your servers. All the same metrics are available in Managed Instances or in Azure SQL Database. Any time you're doing this kind of work, it's best to use the same metrics on both sides, collected, as much as humanly possible, the same way. Compare apples to apples, always. Nothing worse than capturing two different kinds of metrics and then attempting to compare them.
"The credit belongs to the man who is actually in the arena, whose face is marred by dust and sweat and blood"
- Theodore RooseveltAuthor of:
SQL Server Execution Plans
SQL Server Query Performance Tuning -
Hi Sir,
Thanks for the valuable inputs provided.
Couple of follow up questions?
1. Why we need to consider rpc_completed and why I can't I just go with sql_batch_completed? want to understand why rpc_completed is an important one?
2. What specific columns which I need to consider to calculate the response time of a query using the trace? is there specific columns like starttime & endtime and we substract the values and we get the response time ?
Regards,
Sam
-
- If you only have batches, and no prepared statements or stored procedures, fine, you don't need rpc_completed. Otherwise, you do.
- Extended Events is not trace. You don't pick columns. Read the documentation links I provided. You just have to decide the events you're interested in and you're done. You get duration. That's all you need for that measure. You don't have to track down a start and end time. It's the reason I only suggested capturing rpc_completed. There is also an rpc_started event, but you don't need it. You can also do sp_statement_complete or batch_statement_complete to get details inside, but normal processing this is unnecessary.
I gave you the bare minimum to get the job you asked for done. There are tons and tons of details you can go for, but if you're at the point that you don't know the best way to get the broad strokes done, better to focus only on the broad strokes. The details will wait until later.
"The credit belongs to the man who is actually in the arena, whose face is marred by dust and sweat and blood"
- Theodore RooseveltAuthor of:
SQL Server Execution Plans
SQL Server Query Performance Tuning -
Thank you very much Sir. Great information.
Only need to capture qry and its response time so that tomorrow they should come back and complain old or new server.
-
+1 for Grant's advice to use XE.
-
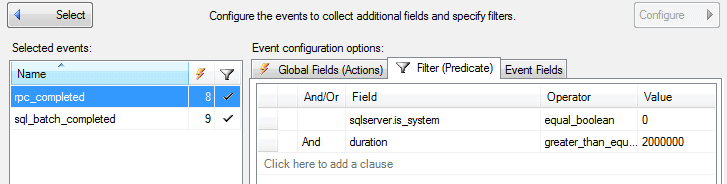
FWIW - I use an extended event on my system to capture any queries that take longer than 2 seconds to execute. I have the extended event set up to output to a file with rollover settings and max size settings. This allows me to look back over a time to see what queries have been taking a longer than normal duration.
When configuring the extended event - you can select specific columns to be returned or exclude columns that you don't need.

When you select the event - default fields will be selected for that event and you only need to configure it if you want to add/remove fields.
Jeffrey Williams
“We are all faced with a series of great opportunities brilliantly disguised as impossible situations.”― Charles R. Swindoll
How to post questions to get better answers faster
Managing Transaction Logs

Viewing 7 posts - 1 through 7 (of 7 total)
You must be logged in to reply to this topic. Login to reply