Help with my table design
-
Hi,
I haven't got any proper DB design knowledge so please be patient and I'll do my best to explain what I'm trying to achieve.
Firstly, I'll be accessing the DB using Python so I won't need this solution to be a one-query-wonder.
Background: I'm designing a Python based CI/CD plugin for a bespoke in-house testing tool. The tool is a load testing tool and churns out min, max, avg, xPercentiles...the usual stuff. The tool has the ability to report on the 80th - 99th percentiles as part of it's functionality. However, the user specifies what percentiles they want to report on. Reporting on them all takes about 10 minutes to compile so it's not suitable for a quick ci/cd solution I'm trying to implement.
I'm not sure if the schema is correct, but I have a column for each percentile. 80th, 81st, 82nd etc. I've taken a test with only 2 transactions but in theory, there could be 100 or even more. Very unlikely, but plausible. Likelihood is maybe up to 15 transactions per test. I appreciate the below scenario is bad practice, but it's the worst case scenario and I need to cater for that in the most optimal way. Here's the scenario I'm stuck with.
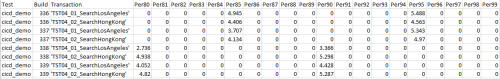
Test 1. User configures the tool to generate the 85th and 95th percentile and runs the test against 2 builds. My data table would look like this:

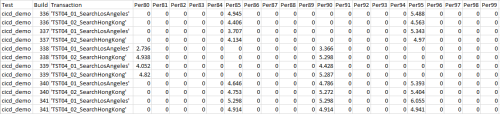
Test 2. User decides to run the next two builds but decides to generate the 80th and 90th percentile. My data table would then look like this:
Test 3. User decides to run the next two builds then decides to generate the 85th, 90th and 95th. My data table would then look like this:
My Requirements:
* I need to generate the percentile averages for all builds (336 to 341) for my test called cicd_demo.
* I want to ignore all of the columns that only have a value of 0.0 ie: Percentile81, 82, 83 etc.
* I want to display the averages for all of the percentiles that were generated for my test cicd_demo.However, I can't simply do a / by number of rows because the generated percentiles that may have 0.0 would skew the average.
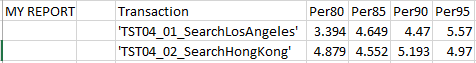
I would expect the report numbers for the averages to look like this:
My question: Have I designed the table incorrectly by having a separate column for each percentile? I see this has having to make loads of select statements to determine which ones contain values (so 20 selects for percent 80 - 99) * (the number of transactions. In this test, transactions are 'TST04_01_SearchLosAngeles' and 'TST04_02_SearchHongKong' but remember, in theory there could be over 100 transactions).
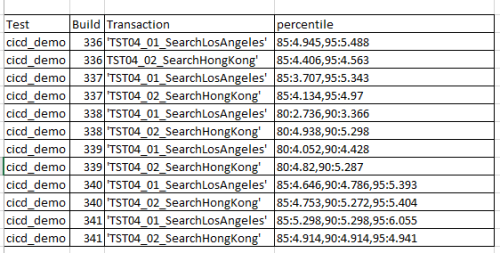
Or, should I have one column called percentile and then somehow delimit the percentile header and its value in one field? Once I select, I can then write some confusing Python code that interprets the delimited data and calculates the averages in code?
Ideally, I'd like to stick with my current schema and somehow calculate the averages using some slick SQL.
The as-is solution with a column for each percentile is easy to do if I do many selects but is that too many in the database world? To be fair, I wouldn't expect more than 2 people running this report concurrently, and my number of rows wouldn't be that many in comparison to the world of big data. Maybe let's say 10 million rows before I'd recommend archiving.
Still awake? Sorry this is so long winded but thought I'd try and be as clear as possible.
Many thanks!
JohnPS. I'm off now and won't be picking this up until Sunday so I'm not ignoring or being rude 🙂 Have a good weekend.
- john_sidney - Friday, July 13, 2018 9:39 AM
I could be wrong as I don't know enough about the business and how it relates to the design but the each percentile having a column seems like repeating groups to me. Even when it's not much data, going down a path with repeating groups generally ends up burning you one way or another.
Sue
-
Hi Sue,
Many thanks for your reply! I've gone and done some thinking; and research and have decided against my old schema.
I'm now embedding the data into one field and will process it using Python.
Many thanks,
John - john_sidney - Tuesday, July 17, 2018 9:56 AM
I think that still puts you in the same boat as it's not a normalized design. It's not in first norm form as you are storing multiple values in the percentile column. It can work for awhile but as I said, it is very likely it will eventually bite you eventually.
Sue

Viewing 4 posts - 1 through 4 (of 4 total)
You must be logged in to reply to this topic. Login to reply