Fastest Way to Calculate Total Number of records inserted per day
-
Hi,
I need to show a number of records per day in the dashboard of the web application if the user reload the page the count will automatically be updated. Initially, we don't have any problem as the records grow to the millions of records the query execution takes slow.
The following is the query we used to get the number of records inserted per day
Is there any alternative query to get the number of records per day?
Select Count(*) from

(Select  t.CreatedOn, Row_Number() Over(Order By t.id Desc) As RowNum
        From List   t
       WHERE CONVERT(DATE,t.CreatedOn)=CONVERT(DATE,DATEADD(HOUR, 0, GETDATE()))
)RowsCount -
your "requirements" do not match what you trying to do on the sql so please do clarify it exactly.
To get the records added today - which is what your subquery is doing, just do
select count(*) as CountRecords
from list t
where t.createdon >= convert(date, getdate())
in order to be fast there needs to exist an index where createdon is the first column on the index
-
frederico_fonseca,
I need to calculate the total number of records in the table inserted for the current date.
For example, i.e Current date is December 8th, so I need to get the records to count starting from December 8th 12:00:00 AM to December 8th 11:59:59 PM time range.
-
that's what fredeico's code does
he uses convert (date) to force it back to midnight
MVDBA
-
To get the number of rows in 'each' table :
           SELECT o.name, SUM(p.rows) sum_rows
   FROM   sys.objects o
   JOIN   sys.partitions p ON o.object_id = p.object_id
   WHERE  p.index_id IN (0, 1)
   GROUP  BY o.name order by sum_rows desc
This query gives a good performance, a fairly accurate number of rows for all the tables, so this can be used as a base for your query.
What is needed, the number of rows of the table(s) at the 'starting' time. This number should be subtracted from the number of rows in this selection. Then it is the actual number of rows so deleted rows are not counted as rows so this does not represent the number of rows inserted, but total number of rows. So If at the start there are 700 rows, 2 rows get deleted and 5 rows get added the number of rows will be 703.
The query works wel and is accurate most of the time. I do not know how the number of rows is handled if there are open transactions which change the number of rows. In my experience the query is very usable and fast.
Greetings,
Ben
- frederico_fonseca wrote:
your "requirements" do not match what you trying to do on the sql so please do clarify it exactly.
To get the records added today - which is what your subquery is doing, just do
select count(*) as CountRecords
from list t
where t.createdon >= convert(date, getdate())
in order to be fast there needs to exist an index where createdon is the first column on the index
This query shall serve the purpose but with minor change as follow.
The below query is sargeable and shall give the same result as with CAST or CONVERT on the column on the LEFT part of the WHERE clause.
-- This is for Date input for which the count is expected.
DECLARE @DateInput DATETIME = '2019-12-10'
SELECT COUNT(1)  as CountRecords
FROM list t
WHERE t.createdon BETWEEN @DateInput AND DATEADD(SECOND, 59, DATEADD(MINUTE, 59, DATEADD(HOUR, 11, @DateInput)))
I would recommend not to use (*) to get the count. I mean why we need to read the Page data in detail to return just the count? We can supply any Constant like (1) and will get the same result but with the better query performance. Suppose if there are 10 columns and 10K rows spread across 50 pages for a particular . If will use the (*) then it will scan through all the 50 pages whereas if will use constant like (1) then it will only read the pages which holds the data for the column used in WHERE clause.
I hope I'm making sense !
- Brahmanand Shukla wrote:frederico_fonseca wrote:
your "requirements" do not match what you trying to do on the sql so please do clarify it exactly.
To get the records added today - which is what your subquery is doing, just do
select count(*) as CountRecords
from list t
where t.createdon >= convert(date, getdate())
in order to be fast there needs to exist an index where createdon is the first column on the index
This query shall serve the purpose but with minor change as follow.
The below query is sargeable and shall give the same result as with CAST or CONVERT on the column on the LEFT part of the WHERE clause.
-- This is for Date input for which the count is expected.
DECLARE @DateInput DATETIME = '2019-12-10'
SELECT COUNT(1)  as CountRecords
FROM list t
WHERE t.createdon BETWEEN @DateInput AND DATEADD(SECOND, 59, DATEADD(MINUTE, 59, DATEADD(HOUR, 11, @DateInput)))
I would recommend not to use (*) to get the count. I mean why we need to read the Page data in detail to return just the count? We can supply any Constant like (1) and will get the same result but with the better query performance. Supposed if there are 10 columns and 10K rows spread across 50 pages for a particular . If will use the (*) then it will scan through all the 50 pages whereas if will use constant like (1) then it will only read the pages which holds the data for the column used in WHERE clause.
Both queries are sargable - yours just a bit more complicated and fails if the createdon is a datetime and if it falls on range 11:59:59.001 to 11:59:59.999
-- This is for Date input for which the count is expected.
declare @DateInput datetime = '2019-12-10'
select createdon
, @DateInput as fromdatetime
, dateadd(second, 59, dateadd(minute, 59, dateadd(hour, 11, @DateInput))) as todatetime
from (values (convert(datetime, '2019-12-10 11:59:59.997'))
, (convert(datetime, '2019-12-10 00:00:00.000'))
) t (createdon)
where t.createdon between @DateInput and dateadd(SECOND, 59, dateadd(minute, 59, dateadd(hour, 11, @DateInput)))
Regarding count(*) vs count(1) your assumptions are incorrect - SQL server will treat both as the same where a count(*) is concerned and it will use the best index to retrieve that count and does not need to go to the grab all data.
If it was count(field) then it would need to get all records to count the contents of that field if it was a nullable field - otherwise would most likely behave as a count(*) (this bit I haven't tested before)
-
Regarding count(*) vs count(1) your assumptions are incorrect - SQL server will treat both as the same where a count(*) is concerned and it will use the best index to retrieve that count and does not need to go to the grab all data.
If it was count(field) then it would need to get all records to count the contents of that field if it was a nullable field - otherwise would most likely behave as a count(*) (this bit I haven't tested before)
Justification of using COUNT(1) over COUNT(*) - I've observed performance gain of up-to 200 MS with 111043178 rows in one of our Production DB. You can also try at your end.
Both queries are sargable - yours just a bit more complicated and fails if the createdon is a datetime and if it falls on range 11:59:59.001 to 11:59:59.999
You are absolutely right. I misinterpreted your WHERE clause and a result of which complicated it.
I was referring to the original query as posted by poster for sargeability.
- Brahmanand Shukla wrote:frederico_fonseca wrote:
your "requirements" do not match what you trying to do on the sql so please do clarify it exactly.
To get the records added today - which is what your subquery is doing, just do
select count(*) as CountRecords
from list t
where t.createdon >= convert(date, getdate())
in order to be fast there needs to exist an index where createdon is the first column on the index
This query shall serve the purpose but with minor change as follow.
The below query is sargeable and shall give the same result as with CAST or CONVERT on the column on the LEFT part of the WHERE clause.
-- This is for Date input for which the count is expected.
DECLARE @DateInput DATETIME = '2019-12-10'
SELECT COUNT(1)  as CountRecords
FROM list t
WHERE t.createdon BETWEEN @DateInput AND DATEADD(SECOND, 59, DATEADD(MINUTE, 59, DATEADD(HOUR, 11, @DateInput)))
I would recommend not to use (*) to get the count. I mean why we need to read the Page data in detail to return just the count? We can supply any Constant like (1) and will get the same result but with the better query performance. Suppose if there are 10 columns and 10K rows spread across 50 pages for a particular . If will use the (*) then it will scan through all the 50 pages whereas if will use constant like (1) then it will only read the pages which holds the data for the column used in WHERE clause.
I hope I'm making sense !
My recommendation would be to stop using the 23:59:59:.997 stuff and use a non-inclusive end date. That also means that you should stop using BETWEEN. Use SomeColumn >= SomeDate and SomeColumn < SomeOtherDate. That's what the "Best Practice" actually is and it is the same no matter what the resolution of the given datatypes are.
Also, do you have some proof of the COUNT(*) vs the COUNT(1) thing? I'm not talking about someone's rhetorical "proof" either. I'm talking about a demonstrable and repeatable bit of test code where anyone can "prove" it to themselves.
--Jeff Moden
RBAR is pronounced "ree-bar" and is a "Modenism" for Row-By-Agonizing-Row.
First step towards the paradigm shift of writing Set Based code:
________Stop thinking about what you want to do to a ROW... think, instead, of what you want to do to a COLUMN.Change is inevitable... Change for the better is not.
Helpful Links:
How to post code problems
How to Post Performance Problems
Create a Tally Function (fnTally) - Jeff Moden wrote:
Also, do you have some proof of the COUNT(*) vs the COUNT(1) thing? I'm not talking about someone's rhetorical "proof" either. I'm talking about a demonstrable and repeatable bit of test code where anyone can "prove" it to themselves.
You sure do like to poke the bear :-/
Far away is close at hand in the images of elsewhere.
Anon. - David Burrows wrote:Jeff Moden wrote:
Also, do you have some proof of the COUNT(*) vs the COUNT(1) thing? I'm not talking about someone's rhetorical "proof" either. I'm talking about a demonstrable and repeatable bit of test code where anyone can "prove" it to themselves.
You sure do like to poke the bear :-/
Heh... it's a bear that needs poking... especially when the damned thing stands up with a target on it. When people make some claim of performance, they need to be prepared to back it up. Too many supposed "Best Practices" that aren't have been created because of such claims. For example, there are still people that claim it's a "Best Practice" to use rCTEs that do incremental counts. Same goes with the COUNT thing. Prove it or cite a good article that actually proves it properly. 😀
--Jeff Moden
RBAR is pronounced "ree-bar" and is a "Modenism" for Row-By-Agonizing-Row.
First step towards the paradigm shift of writing Set Based code:
________Stop thinking about what you want to do to a ROW... think, instead, of what you want to do to a COLUMN.Change is inevitable... Change for the better is not.
Helpful Links:
How to post code problems
How to Post Performance Problems
Create a Tally Function (fnTally) - Jeff Moden wrote:David Burrows wrote:Jeff Moden wrote:
Also, do you have some proof of the COUNT(*) vs the COUNT(1) thing? I'm not talking about someone's rhetorical "proof" either. I'm talking about a demonstrable and repeatable bit of test code where anyone can "prove" it to themselves.
You sure do like to poke the bear :-/
Heh... it's a bear that needs poking... especially when the damned thing stands up with a target on it. When people make some claim of performance, they need to be prepared to back it up. Too many supposed "Best Practices" that aren't have been created because of such claims. For example, there are still people that claim it's a "Best Practice" to use rCTEs that do incremental counts. Same goes with the COUNT thing. Prove it or cite a good article that actually proves it properly. 😀
That's a good thing to be ready to justify ones own claim and I appreciate the attitude shown by fellow participants on this matter. This is the beauty of the community where conflicts are always positive and for the betterment of the community.
Here I go...
To have a clear performance comparison test. I made 2 stored procedures - one with COUNT(*) and another with COUNT(1). Reason for choosing the Stored Procedure for performance test was to avoid plan creation and overhead and cost associated with the plan creation. With stored procedure, the plan shall be re-utilized instead of generating a new one on each run. I ran the stored procedures multiple times before putting the results in front of you guys.
I've masked the table name, column name and server name as it belongs to our Production instance.
Putting here the H/W configuration of the server :
Cores : 16
Memory : 64 GB
Disk : 2 TB
Numa Nodes : 2
MAXDOP : 8
/*
SET STATISTICS IO ON
SET STATISTICS TIME ON

EXEC [usp_PerfTest_Using_Count(1)]
@Evaluate_Based_On_Index = 0

SET STATISTICS IO OFF
SET STATISTICS TIME OFF
*/
CREATE PROCEDURE [usp_PerfTest_Using_Count(1)]
(
@Evaluate_Based_On_IndexBIT
)
AS
BEGIN
SET NOCOUNT ON

DECLARE @StartDATETIME
,@EndDATETIME

-- Using COUNT(1)

SET @Start = GETDATE()

-- Column used in WHERE clause has a Non Clustered Index
IF (@Evaluate_Based_On_Index = 1)
BEGIN
SELECT COUNT(1) FROM <table name> WHERE <column name> >= DATEADD(DD, -1, GETDATE())
END
ELSE
BEGIN
SELECT COUNT(1) FROM <table name>
END

SET @End = GETDATE()

SELECT DATEDIFF(MILLISECOND, @Start, @End) AS [Time_Taken_In_MS_Using COUNT(1)]
END
/*
SET STATISTICS IO ON
SET STATISTICS TIME ON
EXEC [usp_PerfTest_Using_Count(*)]
@Evaluate_Based_On_Index = 0
SET STATISTICS IO OFF
SET STATISTICS TIME OFF
*/
CREATE PROCEDURE [usp_PerfTest_Using_Count(*)]
(
@Evaluate_Based_On_IndexBIT
)
AS
BEGIN
SET NOCOUNT ON
DECLARE @StartDATETIME
,@EndDATETIME
-- Using COUNT(*)
SET @Start = GETDATE()
-- Column used in WHERE clause has a Non Clustered Index
IF (@Evaluate_Based_On_Index = 1)
BEGIN
SELECT COUNT(*) FROM <table name> WHERE <column name> >= DATEADD(DD, -1, GETDATE())
END
ELSE
BEGIN
SELECT COUNT(*) FROM <table name>
END
SET @End = GETDATE()
SELECT DATEDIFF(MILLISECOND, @Start, @End) AS [Time_Taken_In_MS_Using COUNT(*)]
ENDQuery executed for performance comparison
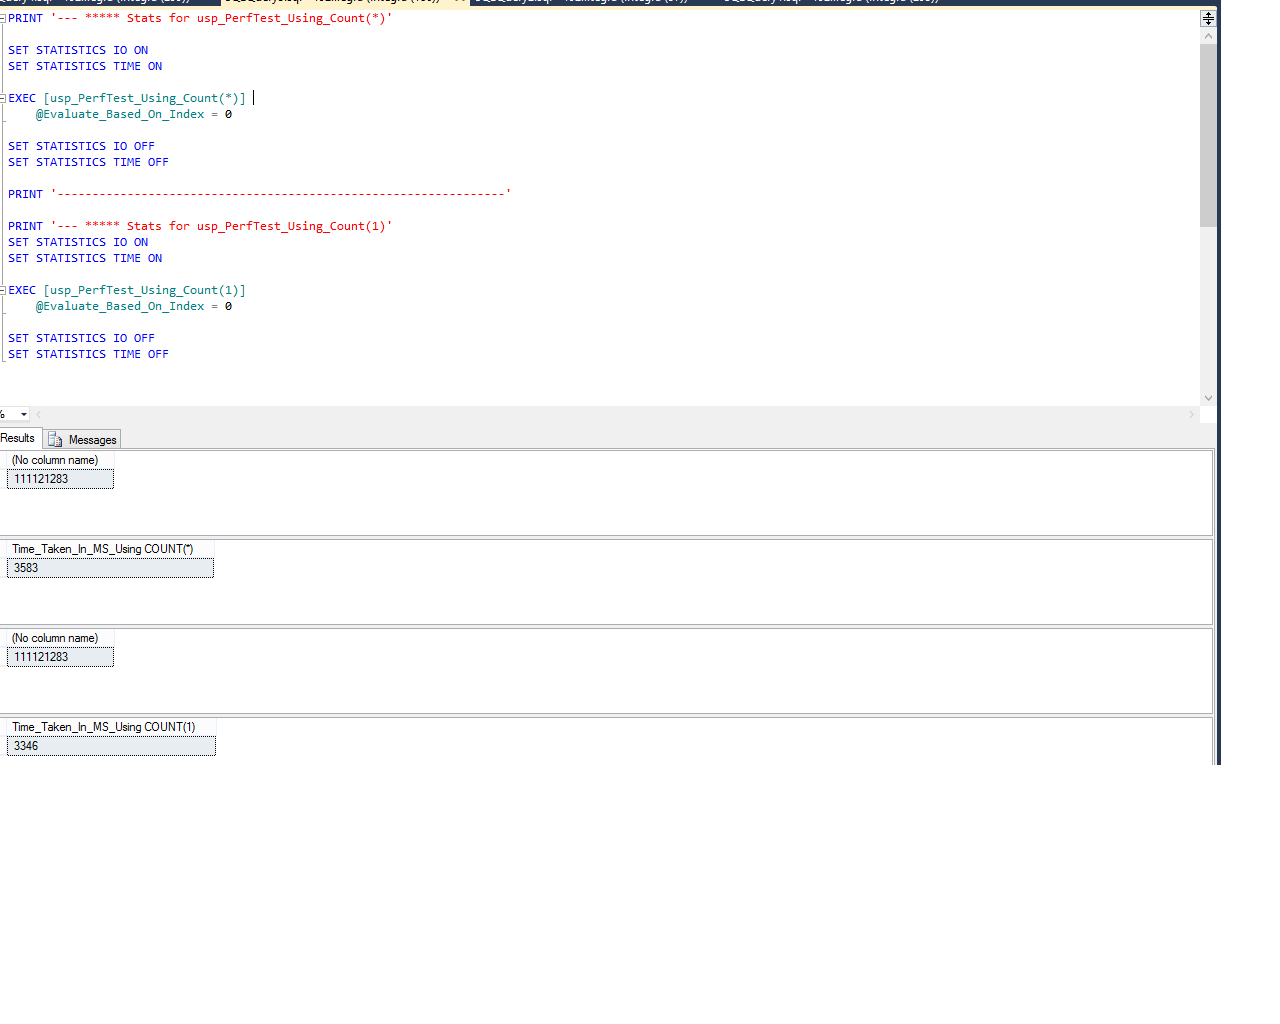
-- ************************************************ All records ******************************************
PRINT '--- ***** Stats for usp_PerfTest_Using_Count(*)'
SET STATISTICS IO ON
SET STATISTICS TIME ON
EXEC [usp_PerfTest_Using_Count(*)]
@Evaluate_Based_On_Index = 0
SET STATISTICS IO OFF
SET STATISTICS TIME OFF
PRINT '----------------------------------------------------------------'
PRINT '--- ***** Stats for usp_PerfTest_Using_Count(1)'
SET STATISTICS IO ON
SET STATISTICS TIME ON
EXEC [usp_PerfTest_Using_Count(1)]
@Evaluate_Based_On_Index = 0
SET STATISTICS IO OFF
SET STATISTICS TIME OFF
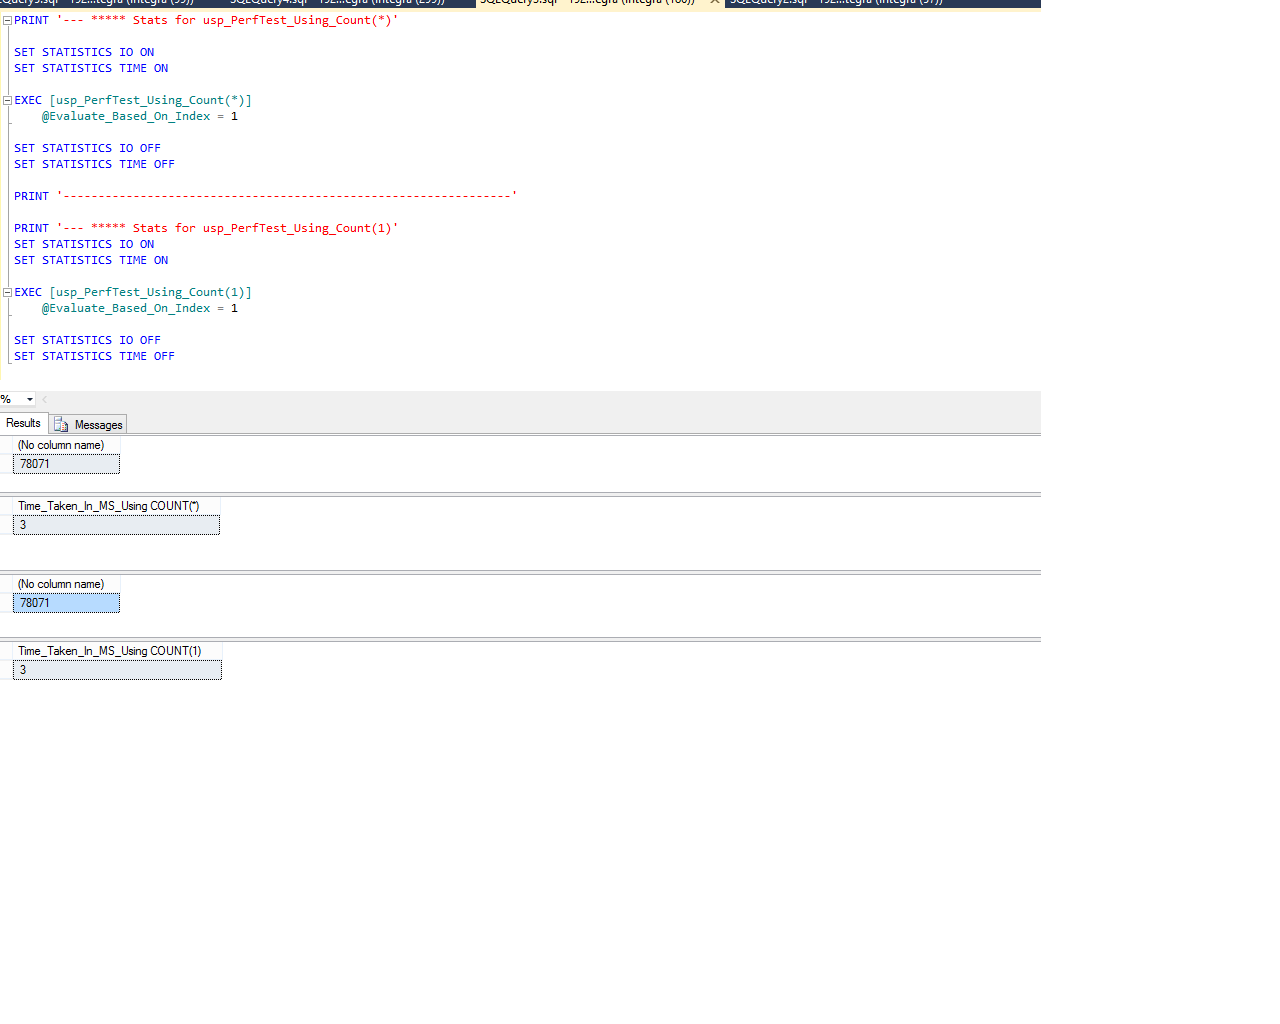
-- ******************************************** Specific Records (Using Nonclustred Index ******************************************
PRINT '--- ***** Stats for usp_PerfTest_Using_Count(*)'
SET STATISTICS IO ON
SET STATISTICS TIME ON
EXEC [usp_PerfTest_Using_Count(*)]
@Evaluate_Based_On_Index = 1
SET STATISTICS IO OFF
SET STATISTICS TIME OFF
PRINT '----------------------------------------------------------------'
PRINT '--- ***** Stats for usp_PerfTest_Using_Count(1)'
SET STATISTICS IO ON
SET STATISTICS TIME ON
EXEC [usp_PerfTest_Using_Count(1)]
@Evaluate_Based_On_Index = 1
SET STATISTICS IO OFF
SET STATISTICS TIME OFFOutput & STATISTICS IO/TIME for All Records

-- All records

--- ***** Stats for usp_PerfTest_Using_Count(*)
SQL Server parse and compile time:
   CPU time = 0 ms, elapsed time = 0 ms.

 SQL Server Execution Times:
   CPU time = 0 ms,  elapsed time = 0 ms.

 SQL Server Execution Times:
   CPU time = 0 ms,  elapsed time = 0 ms.

 SQL Server Execution Times:
   CPU time = 0 ms,  elapsed time = 0 ms.
Table '<table name>'. Scan count 17, logical reads 335548, physical reads 0, read-ahead reads 0, lob logical reads 0, lob physical reads 0, lob read-ahead reads 0.

 SQL Server Execution Times:
   CPU time = 7723 ms,  elapsed time = 3583 ms.

 SQL Server Execution Times:
   CPU time = 0 ms,  elapsed time = 0 ms.

 SQL Server Execution Times:
   CPU time = 0 ms,  elapsed time = 0 ms.

 SQL Server Execution Times:
   CPU time = 7723 ms,  elapsed time = 3583 ms.

 SQL Server Execution Times:
   CPU time = 0 ms,  elapsed time = 0 ms.
----------------------------------------------------------------
--- ***** Stats for usp_PerfTest_Using_Count(1)
SQL Server parse and compile time:
   CPU time = 0 ms, elapsed time = 0 ms.

 SQL Server Execution Times:
   CPU time = 0 ms,  elapsed time = 0 ms.

 SQL Server Execution Times:
   CPU time = 0 ms,  elapsed time = 0 ms.

 SQL Server Execution Times:
   CPU time = 0 ms,  elapsed time = 0 ms.
Table '<table name>'. Scan count 17, logical reads 335548, physical reads 0, read-ahead reads 0, lob logical reads 0, lob physical reads 0, lob read-ahead reads 0.

 SQL Server Execution Times:
   CPU time = 7488 ms,  elapsed time = 3346 ms.

 SQL Server Execution Times:
   CPU time = 0 ms,  elapsed time = 0 ms.

 SQL Server Execution Times:
   CPU time = 0 ms,  elapsed time = 0 ms.

 SQL Server Execution Times:
   CPU time = 7488 ms,  elapsed time = 3346 ms.

 SQL Server Execution Times:
   CPU time = 0 ms,  elapsed time = 0 ms.
Output & STATISTICS IO/TIME for Specific Records based on DATE column with Non Clustered Index
-- Specific Records (Using Nonclustred Index

--- ***** Stats for usp_PerfTest_Using_Count(*)
SQL Server parse and compile time:
   CPU time = 0 ms, elapsed time = 0 ms.

 SQL Server Execution Times:
   CPU time = 0 ms,  elapsed time = 0 ms.

 SQL Server Execution Times:
   CPU time = 0 ms,  elapsed time = 0 ms.

 SQL Server Execution Times:
   CPU time = 0 ms,  elapsed time = 0 ms.
Table '<table name>'. Scan count 1, logical reads 314, physical reads 0, read-ahead reads 0, lob logical reads 0, lob physical reads 0, lob read-ahead reads 0.

 SQL Server Execution Times:
   CPU time = 16 ms,  elapsed time = 3 ms.

 SQL Server Execution Times:
   CPU time = 0 ms,  elapsed time = 0 ms.

 SQL Server Execution Times:
   CPU time = 0 ms,  elapsed time = 0 ms.

 SQL Server Execution Times:
   CPU time = 16 ms,  elapsed time = 3 ms.

 SQL Server Execution Times:
   CPU time = 0 ms,  elapsed time = 0 ms.
----------------------------------------------------------------
--- ***** Stats for usp_PerfTest_Using_Count(1)
SQL Server parse and compile time:
   CPU time = 0 ms, elapsed time = 0 ms.

 SQL Server Execution Times:
   CPU time = 0 ms,  elapsed time = 0 ms.

 SQL Server Execution Times:
   CPU time = 0 ms,  elapsed time = 0 ms.

 SQL Server Execution Times:
   CPU time = 0 ms,  elapsed time = 0 ms.
Table '<table name>'. Scan count 1, logical reads 314, physical reads 0, read-ahead reads 0, lob logical reads 0, lob physical reads 0, lob read-ahead reads 0.

 SQL Server Execution Times:
   CPU time = 0 ms,  elapsed time = 3 ms.

 SQL Server Execution Times:
   CPU time = 0 ms,  elapsed time = 0 ms.

 SQL Server Execution Times:
   CPU time = 0 ms,  elapsed time = 0 ms.

 SQL Server Execution Times:
   CPU time = 0 ms,  elapsed time = 3 ms.

 SQL Server Execution Times:
   CPU time = 0 ms,  elapsed time = 0 ms.
Did not attached the Execution Plan as it was almost same for both the cases.
Conclusion :
Although, the Logical & Physical Reads were same for both COUNT(1) & COUNT(*) but I've observed performance gain of almost 237 Milliseconds with COUNT(1). I feel that's a descent achievement !
-
Interesting, sins of version of 2008 the COUNT(*) vs COUNT(1) should generate the same execution plan.(column 1 should be pk/not null). Also count won't read any data from the column(s), only the where clause fetch data.
Q: Did you run the test one time or 10+ times?
Sample of query plans and performance for count.
-
Around 2-3 times.
-
Back to the original question, that takes to long time.(many seconds to long time)
bhavi wrote:Hi,
I need to show a number of records per day in the dashboard of the web application if the user reload the page the count will automatically be updated. Initially, we don't have any problem as the records grow to the millions of records the query execution takes slow.
Note that doing count, makes a lock, to be able to do the count, that can also degrade the performance for other users.
- How often do we refresh and how many dashboards are we taking about?
- Is it possible to add a table containing something like, DateTime, TableName, RowCount?
- Is it possible to access system tables/system procedures?
- How accurate does it have to be?
There are several links about to fetch the total row count.
Viewing 15 posts - 1 through 15 (of 23 total)
You must be logged in to reply to this topic. Login to reply