extended events captures duplicated records
-
1. here is the extended events:
drop event session [XE_CPUUsage] on serverdeclare @ServerName as nvarchar(max) = replace(@@SERVERNAME,'\','_')
declare @filename as nvarchar(max)
declare @metadatafile as nvarchar(max)
set @filename = N'c:\temp\XEventSessions\XE_CPUUsage_'+@ServerName+'.xel'declare @sql as nvarchar(max)
set @sql = '
CREATE EVENT SESSION [XE_CPUUsage] ON SERVER
ADD EVENT sqlserver.sp_statement_completed(
ACTION(package0.collect_system_time,sqlos.task_time,sqlserver.client_app_name,sqlserver.database_name,sqlserver.query_hash,sqlserver.query_plan_hash,sqlserver.server_instance_name,sqlserver.server_principal_name,sqlserver.sql_text)
WHERE ([cpu_time]>=(400000))),
ADD EVENT sqlserver.sql_statement_completed(
ACTION(package0.collect_system_time,sqlos.task_time,sqlserver.client_app_name,sqlserver.database_name,sqlserver.query_hash,sqlserver.query_plan_hash,sqlserver.server_instance_name,sqlserver.server_principal_name,sqlserver.sql_text)
WHERE ([cpu_time]>=(400000) and [sqlserver].[query_hash]<>(0)))
ADD TARGET package0.asynchronous_file_target
(SET filename = '''+ @filename +''',
max_file_size=(65536),
max_rollover_files=5)
WITH (MAX_DISPATCH_LATENCY = 5SECONDS)
'--select @sql
exec sp_executesql @sqlALTER EVENT SESSION [XE_CPUUsage] ON SERVER
WITH (STARTUP_STATE=ON)
GOalter event session [XE_CPUUsage] on server
state = start ;
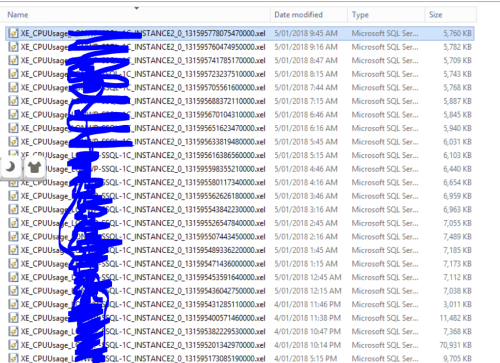
GO2. I run my small tool, to stop the above EX and collect the files to a server,
Here is an example of the files:
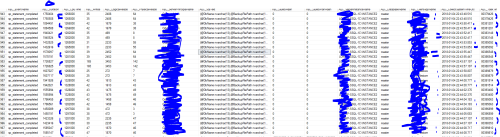
3. I take one of the file and read the content:
SET QUOTED_IDENTIFIER ON
SET NOCOUNT ONSELECT CAST(event_data AS XML) AS event_data
INTO #captured_data
FROM sys.fn_xe_file_target_read_file
('C:\CollectedXEvents_History_Sample\XE_CPUUsage_INSTANCE2_0_131595778075470000.xel',
null, null, null)
;WITH CTE_EVENTS AS
(
SELECT
c.value('(@name)[1]', 'nvarchar(250)') AS [XEC_EventName],
c.value('(data[@name="duration"]/value)[1]', N'bigint') AS [XEC_Duration],
c.value('(data[@name="cpu_time"]/value)[1]', N'bigint') AS [XEC_CpuTime],
c.value('(data[@name="writes"]/value)[1]', N'bigint') AS [XEC_Writes],
c.value('(data[@name="logical_reads"]/value)[1]', N'bigint') AS [XEC_LogicalReads],
c.value('(data[@name="physical_reads"]/value)[1]', N'bigint') AS [XEC_PhysicalReads],
c.value('(action[@name="server_principal_name"]/value)[1]', N'sysname') AS [XEC_ServerPrincipalName],
isnull(c.value('(action[@name="sql_text"]/value)[1]', N'nvarchar(max)'),c.value('(action[@name="statement"]/value)[1]', N'nvarchar(max)')) AS [XEC_SqlText],
c.value('(action[@name="query_hash"]/value)[1]', N'varchar(32)') AS [XEC_QueryHash],
c.value('(action[@name="query_plan_hash"]/value)[1]', N'varchar(32)') AS [XEC_QueryPlanHash],
c.value('(action[@name="server_instance_name"]/value)[1]', N'sysname') AS [XEC_ServerInstanceName],
c.value('(action[@name="database_name"]/value)[1]', N'sysname') AS [XEC_DatabaseName],
c.value('(action[@name="client_app_name"]/value)[1]', N'sysname') AS [XEC_ClientAppName],
c.value('(action[@name="collect_system_time"]/value)[1]', N'datetime') AS [XEC_CollectSystemTimeUtc],
c.value('(action[@name="task_time"]/value)[1]', N'bigint') AS [XEC_TaskTime]
FROM #captured_data
CROSS APPLY event_data.nodes('//event') AS t (c)
)--select count(distinct [XEC_CollectSystemTimeUtc]) from CTE_EVENTS
select * from CTE_EVENTS
order by XEC_CollectSystemTimeUtc
drop table #captured_datahere is the result: you can every statement has two duplicated records, the only column has difference is the Duration column in two records.
Not sure if it is configuration of the EX problem, or a bug...
-
Hard to tell from what you have posted. Can't really tell what was captured, even enlarged to output is hard to read and we can't expand the columns of data that you didn't mark up to see all the data.
I don't have the time today to play with your code, but perhaps tomorrow I squeeze in some time.
-
sp_statement_completed is captured in this case.
Columns are:
c.value('(@name)[1]', 'nvarchar(250)') AS [XEC_EventName],
c.value('(data[@name="duration"]/value)[1]', N'bigint') AS [XEC_Duration],
c.value('(data[@name="cpu_time"]/value)[1]', N'bigint') AS [XEC_CpuTime],
c.value('(data[@name="writes"]/value)[1]', N'bigint') AS [XEC_Writes],
c.value('(data[@name="logical_reads"]/value)[1]', N'bigint') AS [XEC_LogicalReads],
c.value('(data[@name="physical_reads"]/value)[1]', N'bigint') AS [XEC_PhysicalReads],
c.value('(action[@name="server_principal_name"]/value)[1]', N'sysname') AS [XEC_ServerPrincipalName],
isnull(c.value('(action[@name="sql_text"]/value)[1]', N'nvarchar(max)'),c.value('(action[@name="statement"]/value)[1]', N'nvarchar(max)')) AS [XEC_SqlText],
c.value('(action[@name="query_hash"]/value)[1]', N'varchar(32)') AS [XEC_QueryHash],
c.value('(action[@name="query_plan_hash"]/value)[1]', N'varchar(32)') AS [XEC_QueryPlanHash],
c.value('(action[@name="server_instance_name"]/value)[1]', N'sysname') AS [XEC_ServerInstanceName],
c.value('(action[@name="database_name"]/value)[1]', N'sysname') AS [XEC_DatabaseName],
c.value('(action[@name="client_app_name"]/value)[1]', N'sysname') AS [XEC_ClientAppName],
c.value('(action[@name="collect_system_time"]/value)[1]', N'datetime') AS [XEC_CollectSystemTimeUtc],
c.value('(action[@name="task_time"]/value)[1]', N'bigint') AS [XEC_TaskTime] -
But I can't see what your results are so I have no idea what is being displayed.
Viewing 4 posts - 1 through 4 (of 4 total)
You must be logged in to reply to this topic. Login to reply