Error Grafana SQLWATCH
-
hello ,
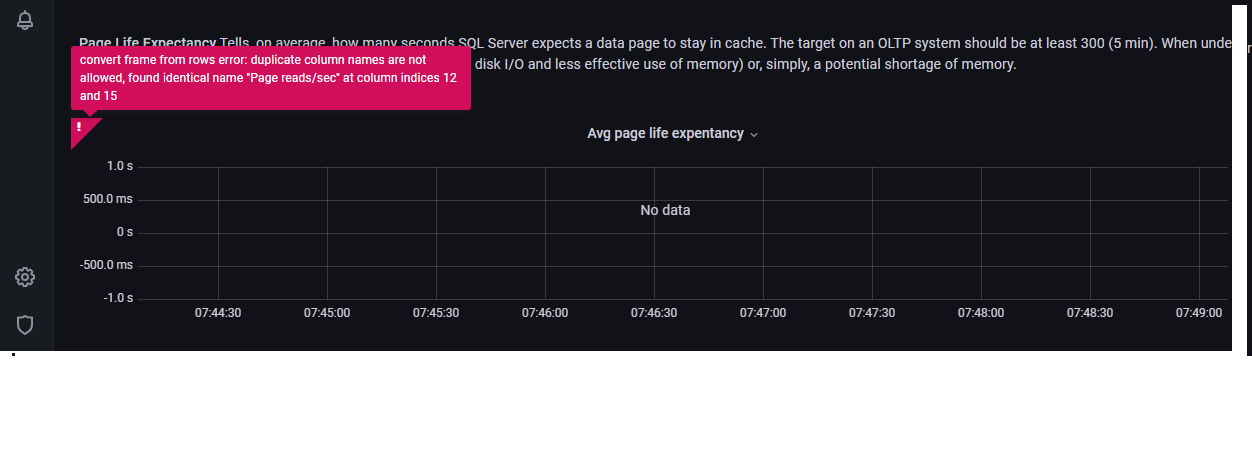
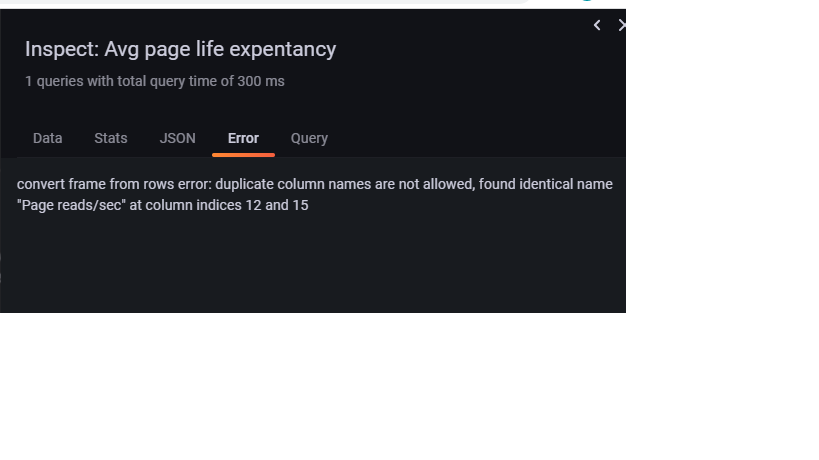
I am looking for a Grafana expert to help me with this display error
This is SQLWATCH configured on GRafana
all the indicators are displayed correctly except the PLE counter

-
You may be better off asking questions on SQLWATCH.IO here:
There may also be clues with this Linux Perfmon type solution which uses Grafana for the dashboard:
https://github.com/microsoft/mssql-monitoring
Viewing 2 posts - 1 through 2 (of 2 total)
You must be logged in to reply to this topic. Login to reply