Disk Reads and Writes
-
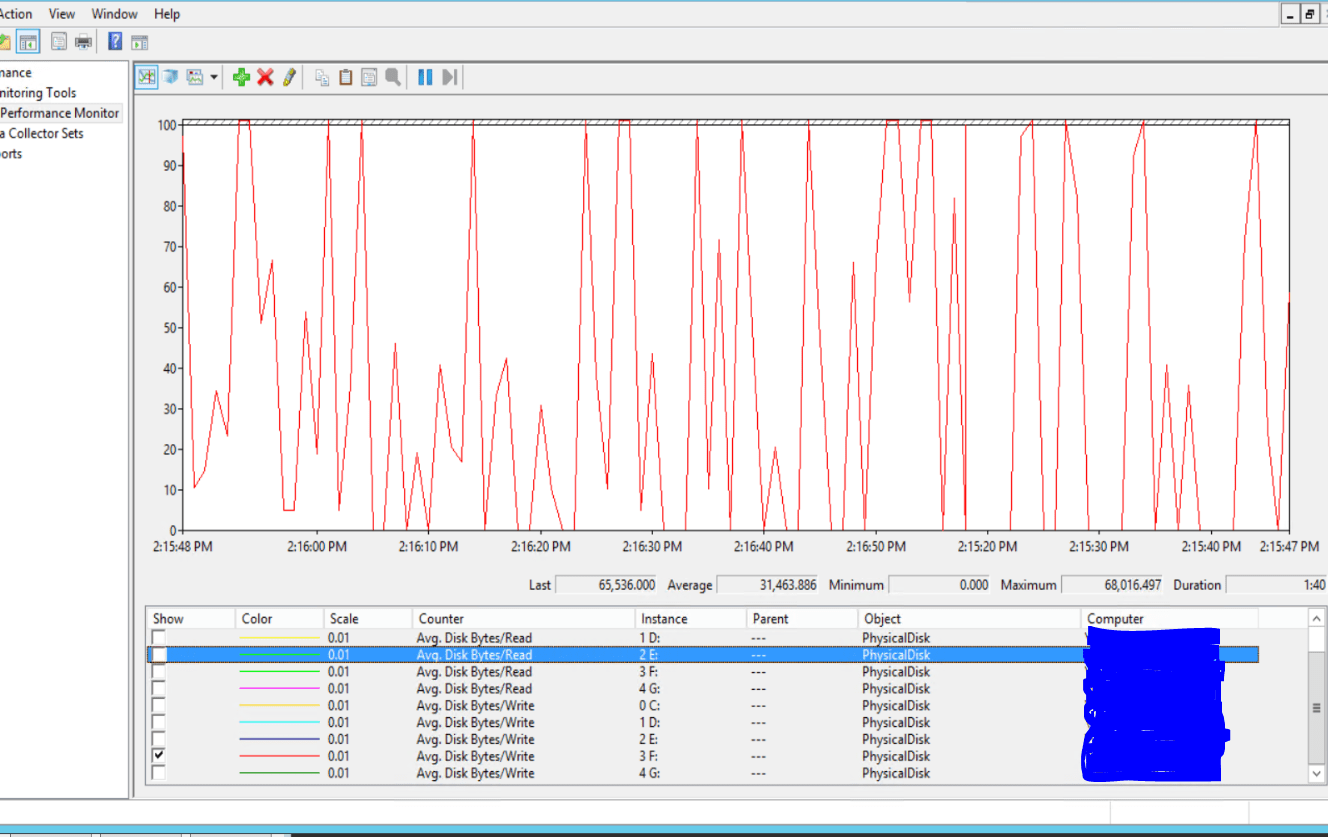
This could be causing (at least one element) my afternoon "slowness" reported by some apps. I am aware there are many things to check, but does this write percentage in Performance Monitor seem high for SQL? Any other type of server, I would say a firm "yes", but SQL is very intensive with writing to the logs (this is the disk for logs of about 200 DBs).

Also, the disk with the data files seems high for Reads (which I would expect), does this seem high also?
-
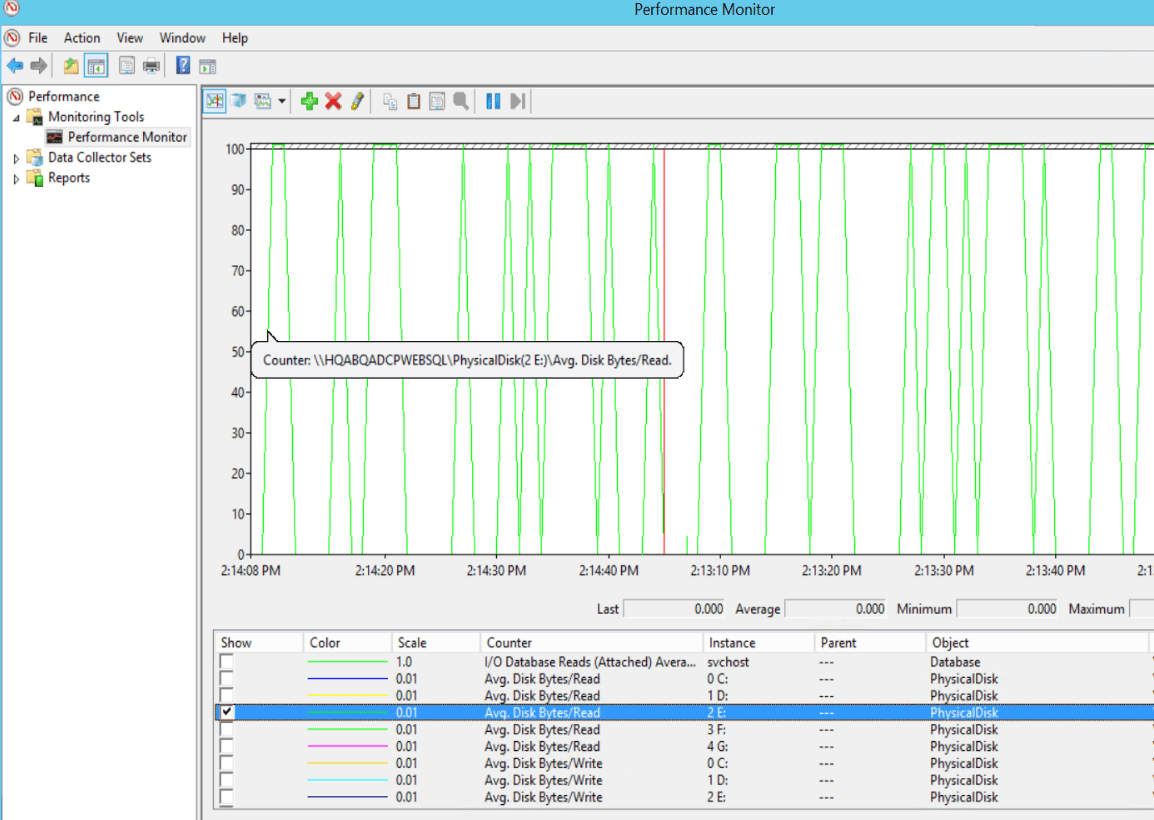
looking at the graphs doesn't mean much if you don't have a reasonable scale. your scale of 0 to 100 doesn't really tell us much as 0 to 100 bytes per read/write on average is not many bytes at all. As your scale only goes up to 100, any spike that touches that 100 mark is either 100 or MORE. It could be 101 or it could be 100,000,000,000,000,000. Perfmon doesn't care. 100 or less shows meaningful values on the graph (as can be seen in the first graph) when you have the default metrics applied. The graph shows a lot of peaks to 100 or more and shows a lot of under 100 as well. having an average of 100 bytes or less per write isn't worth investigating in my opinion.
So my advice is if your scale isn't helpful, neither is the graph. Now, if you ignore the graph data and use the actual numbers, in your first screenshot we can see that your average disk bytes per read is averaging at 31.5 KB per read (approximately) and had a maximum of 68 KB per read. To me, these numbers don't seem high at all. I just ran this on my desktop and my spikes are less frequent (which I'd expect), but my max was 56.7 KB per read. So my desktop disk (an SSD) is having a max average disk bytes per read that is similar to yours and I know I am not concerned about my desktop performance in the slightest with a spike like that.
TL;DR - those graphs are not really helpful. The numbers shown in the first graph are, but are not large enough to be interesting. Chances are your slowness is due to something other than disk I/O. if you want to watch for disk bottlenecks, your disk queue length will be more helpful than the average bytes read or written. Or even the actual disk bytes read or written, not the average.
The above is all just my opinion on what you should do.
As with all advice you find on a random internet forum - you shouldn't blindly follow it. Always test on a test server to see if there is negative side effects before making changes to live!
I recommend you NEVER run "random code" you found online on any system you care about UNLESS you understand and can verify the code OR you don't care if the code trashes your system. -
What's slowness? Slow response to a click on a screen? slow query performance?
If you don't measure what is normal, or what is an average, it's hard to know. Graphs are useless, other than noting relative changes. To dig in, you need numbers.
-
Disk reads, writes and percentages of reads, writes in and of themselves don't necessarily hurt performance or mean that much. It's latency with your reads, writes that impact performance. It could be disks or it could be a lot of other things. I guess you already know that from your initial post but I would look at moving away from Perf mon for the disks and monitor the numbers in sys.dm_io_virtual_file_stats instead since that will give you information on latency. The following article from sqlskills has an example of doing this - there are some other IO related articles on their site worth reading as well:
Capturing IO latencies for a period of time
Sue
-
Thanks for the helpful info - I will look into all of these suggestions.
Viewing 5 posts - 1 through 5 (of 5 total)
You must be logged in to reply to this topic. Login to reply