Databases in AlwaysOn Availability Group show "Synchronized" but they're not
-
Hi,
Has anyone ever encountered a situation with an AOAG where the databases in the AG state that they're synchronized but in fact there is different data between the tables in the database?
I have an AOAG with synchronous commit mode and yet only *some* data is synching--and it's inconsistent.
A few things:
I checked the Failover Cluster Manager Cluster Event log and this is the only error:
Event ID: 1196. "Cluster network name resource 'Cluster Name' failed registration of one or more associated DNS name(s) for the following reason: DNS operation refused"
The fact that some data is synching makes me doubt that this error is the reason, but I suppose it could be. I checked the Windows event logs and this error has been happening for a little while--so again, I'm not sure that this for sure the issue.
I ran this:
SELECT database_state_desc, synchronization_health_desc, synchronization_state_desc
FROM sys.dm_hadr_database_replica_states
WHERE is_local = 1which returned:
ONLINE, HEALTHY, SYNCHRONIZED
Can anyone offer some guidance on how I might be able to get these to start synching completely again?
Thanks in advance,
Mike
EDIT: I should also mention that this is in a virtual environment. I don't know if there's anything VM-specific that would cause this...
Mike Scalise, PMP
https://www.michaelscalise.com -
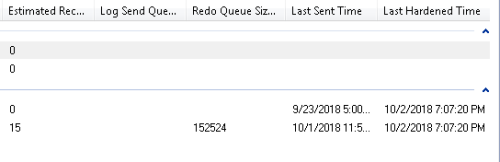
Under the Always On High Availability node in Object Explorer - find the Availability Group, right-click on the group and show the dashboard. In the dashboard - you want to include the columns to show the estimated recovery time, log send queue, redo queue - and the last sent/hardened (and others if needed) times.
Verify that these values are current - and if not you want to start looking into which one is backed up. For example, if the log send queue is high - and the redo queue is low, then the primary system is backed up sending transactions to the secondary. If the redo queue is high and the log send queue is low then the secondary is backed up processing the data that was sent...
Once you have identified where the problem resides - then you can look at what is causing that problem. If the redo queue is not processing down (redo rate is very low or the values are not getting smaller) - then you may have some other processing that is blocking the redo queue. If the log send queue is getting larger - but you do not see the redo queue getting larger - then you may have some processing blocking the send queue.
Jeffrey Williams
“We are all faced with a series of great opportunities brilliantly disguised as impossible situations.”― Charles R. Swindoll
How to post questions to get better answers faster
Managing Transaction Logs - Jeffrey Williams 3188 - Tuesday, October 2, 2018 4:12 PM
Jeffrey, thank you so much for the detailed response. I followed your advice and added the columns to the dashboard, but I have to be honest--I don't know for sure if what I'm looking at is problematic or not. I've attached a picture. The bottom one is the database I'm particularly concerned about...

You mentioned, if the log send queue is high and the redo is low, it could be an issue. I'm not seeing a value for the long send queue at all...so I'm not sure what the heck is going on.Mike
Mike Scalise, PMP
https://www.michaelscalise.com - Mike Scalise - Tuesday, October 2, 2018 5:15 PM
There appears to be a problem with the redo queue - as you can see the size is 152524 and the last sent item is from last night. Include the other last time columns to see when the last transaction was committed/received/...
You can start with this article: https://blogs.msdn.microsoft.com/alwaysonpro/2015/01/06/troubleshooting-redo-queue-build-up-data-latency-issues-on-alwayson-readable-secondary-replicas-using-the-wait_info-extended-event/
The reason you are not seeing the data in the secondary is because it hasn't been committed yet. The reason this hasn't shown up as an issue on the primary is because the log records don't have to be committed or hardened on the secondary, just recorded in the transaction log on the secondary. In other words - the transactions don't have to be replayed into the mirrored data - just available to be replayed for recovery.
There are plenty of other articles you can find - they will have other ideas on how to identify what is blocking the redo queue.
You should also consider creating RTO and RPO policies to check for these types of conditions and alert when encountered. Additionally, there are quite a few agent alerts you can create to let you know when something happens. I would recommend getting those enabled/created as soon as possible...
Jeffrey Williams
“We are all faced with a series of great opportunities brilliantly disguised as impossible situations.”― Charles R. Swindoll
How to post questions to get better answers faster
Managing Transaction Logs - Jeffrey Williams 3188 - Tuesday, October 2, 2018 5:38 PM
Jeffrey,
A few updates! First, I want to say thanks again for taking the time to help me analyze this.
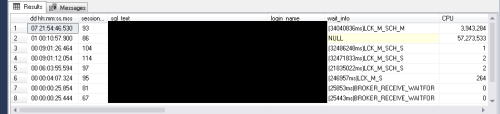
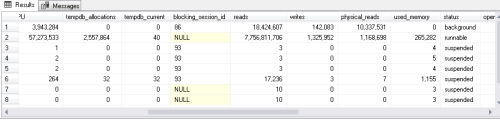
It's interesting you mentioned alerts because I actually have quite a few set up already -- AG Role Change, AG Replica State Change, AG Data Movement Suspended/Resumed, AG is offline, etc. As it turns out, after checking for open transactions and a few other things, I decided to run sp_WhoIsActive on the secondary, and sure enough, there was a long-running query (from a report) that was blocking other resources. Ok, so I killed that process and everything started to flow again. I'm sure I could set up some alert or job to email or text if there is a situation like this again (i.e., if a query reaches thresholds for duration, cpu usage, reads, writes, or some combination thereof).
However, it has made me start to wonder if there's a way to prevent the select query from blocking an operation such as hardening data on the secondary. I mean, I care more about transactions being committed on the secondary replica than I do about the speed of report data coming back. Do you know if there's a way to make committing the data a priority? What if I changed the transaction isolation level of the user the reporting tool connects as to Read Uncommitted? Would that have allowed the data to be hardened in this case?
Also, I've included a portion of the sp_WhoIsActive results in case you cared to see what I saw.
Thanks,
Mike
Mike Scalise, PMP
https://www.michaelscalise.com -
The secondary database is already set to read-only...no locks will be taken out on the query. The reason queries can block is because they utilize tempdb - and can block transactions using the version store, or those queries utilize all available space in tempdb and prevent the redo queue from processing the transactions. The locks that will be taken out are schema locks to prevent any changes to the schema while the query is running (which would block the redo queue if there were schema changes being made).
You could (potentially - since I haven't bothered to try) implement resource governor and attempt to limit the amount of resources for those queries. You could also build a monitor process that kills any long-running queries. What I did was implement the RPO/RTO policies and if they are exceeded, I can then review what is processing, who is processing the query and then address the bad query or process (if needed).
Here is an article that walks you through monitoring for RPO and RTO and how to create a policy that monitors for these conditions and alerts when they are exceeded. https://docs.microsoft.com/en-us/sql/database-engine/availability-groups/windows/monitor-performance-for-always-on-availability-groups?view=sql-server-2017
These policies will also help identify when the system backs up due to index rebuilds or other large modifications that have occurred on the primary.
Jeffrey Williams
“We are all faced with a series of great opportunities brilliantly disguised as impossible situations.”― Charles R. Swindoll
How to post questions to get better answers faster
Managing Transaction Logs - Jeffrey Williams 3188 - Wednesday, October 3, 2018 3:10 PM
"no locks will be taken out on the query"
Is that true? I thought that SELECT statements acquire a shared lock on the tables accessed. It shouldn't affect other SELECT statements from accessing the same tables, but if any process tries to insert or update data in the tables (i.e., uncommitted transactions), then they will be blocked. Do I have that wrong?
If it isn't that and instead is the lack of space in tempdb on the secondary that's causing blocking, then you're saying that I kind of need to be reactive? In other words, if I can't control (tune) the query that's being passed in, then it's just going to fill up tempdb and never finish--so I need to be reactive by either limiting it with Resource Governor, or auditing and getting alerted (and possibly killing the process)?
I guess what I'm asking is, can I have my cake and eat it too--eliminate any potential for blockage on the secondary so that I can be confident transactions will always be committed...
Thanks,
MikeMike Scalise, PMP
https://www.michaelscalise.com - Mike Scalise - Wednesday, October 3, 2018 6:43 PM
The secondary is read only. The cannot be any updates or inserts on the secondary. The database works the same way as RCSI and reads data from the version store.
Jeffrey Williams
“We are all faced with a series of great opportunities brilliantly disguised as impossible situations.”― Charles R. Swindoll
How to post questions to get better answers faster
Managing Transaction Logs -
And yes, you need to be reactive once the queries are running or proactive and fix the worries before they cause a problem
Jeffrey Williams
“We are all faced with a series of great opportunities brilliantly disguised as impossible situations.”― Charles R. Swindoll
How to post questions to get better answers faster
Managing Transaction Logs - Mike Scalise - Tuesday, October 2, 2018 3:29 PM
Synchronous only means that the log records between the partners are synchronised and hardened to the logs, the redo threads on the secondaries wont necessarily provide up to date data especially on busy systems.
If the data is wildly behind check that data movements havent been suspended to that replica-----------------------------------------------------------------------------------------------------------
"Ya can't make an omelette without breaking just a few eggs" 😉
- Perry Whittle - Thursday, October 4, 2018 3:28 AM
Perry--thank you for the clarification. That all makes sense.
Mike Scalise, PMP
https://www.michaelscalise.com -
Hi,
I'm revisiting this now--I just want to make sure I completely understand here...
The reason queries can block is because they utilize tempdb - and can block transactions using the version store, or those queries utilize all available space in tempdb and prevent the redo queue from processing the transactions.
So in my case, how can I tell whether it was a block of transactions using the version store or whether the queries just used all of the available space in tempdb?
Also, if I were to leverage Resource Governor, which specific resource would I limit such that blocking wouldn't occur and my redo queue doesn't get so backed up?
Thanks again, everyone.
Mike
Mike Scalise, PMP
https://www.michaelscalise.com
Viewing 12 posts - 1 through 12 (of 12 total)
You must be logged in to reply to this topic. Login to reply