Building Flame Diagram for MSSQL stored procedures
-
I wanted to share with you tools from my personal toolbox.
If your code has many nested executions of stored procedures, you can benefit from building popular "flame diagram" of the execution time which is de facto standard for performance profiling.

Here is step-by-step guide.
Creation of a trace
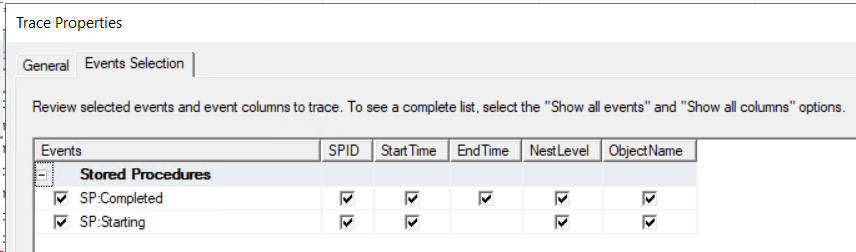
Start SQL profiler and select the following events:
- SP:Starting
- SP:Completed
Select the following columns:
- ObjectName
- NestLevel
- StartTime
- EndTime
- Spid
In the filters, select condition based on Spid, which must select one particular Spid. The analysis is checking just one execution flow, so different connections should not mix in a trace.
Save you trace in a database when enough events are recorded. In that database, create the following stored procedure:
create procedure flame
  @trname sysname, @spname sysname, @start int=0
as
  -- Trace must contain Sp:Start, Sp:Completed, StartTime, EndTime, Nestlevel, ObjectName
  -- 1 SPID should be recorded
  set nocount on
  declare @r int, @b int, @e int, @t datetime, @class int, @lev int, @obj varchar(255), @prevt datetime,
    @stack varchar(max)='', @prevstack varchar(max)='', @sql varchar(1000)
  create table #trace (RowNumber int, EventClass int, StartTime datetime, EndTime datetime, NestLevel int, ObjectName nvarchar(255))
  set @sql = 'insert into #trace select RowNumber,EventClass,StartTime,EndTime,Nestlevel,ObjectName from '+@trname+' where EventClass in (42,43)'
  exec (@sql)
  select (select max(RowNumber) from #trace I where I.EventClass=42 and I.ObjectName=@spname and I.Nestlevel=1 and I.RowNumber<O.RowNumber) as [Start],
    O.RowNumber as [End], StartTime, EndTime, datediff(ms, StartTime, endTime) as DurationMs
    from #trace O where EventClass=43 and ObjectName=@spname and Nestlevel=1
    order by 1
  select @b=min(RowNumber) from #trace where EventClass=42 and ObjectName=@spname and NestLevel=1 and RowNumber>=@start
  if @b is null begin print 'procedure: start not found' return end
  select @e=min(RowNumber) from #trace where EventClass=43 and ObjectName=@spname and RowNumber>@b and Nestlevel=1
  if @e is null begin print 'procedure: end not found' return end
  select 'Selected', @b as [Start], @e as [End]
  DECLARE my_cur CURSOR FOR SELECT RowNumber,EventClass,isnull(EndTime,StartTime),NestLevel,ObjectName
    from #trace where RowNumber>=@b and RowNumber<=@e order by RowNumber
  OPEN my_cur
  FETCH NEXT FROM my_cur INTO @r, @class, @t, @lev, @obj
  WHILE @@FETCH_STATUS = 0
  BEGIN
    if @class=42 set @stack = @stack + ';' + @obj
else set @stack=reverse(substring(reverse(@stack),charindex(';', reverse(@stack))+1,100000))
if @prevt is not null print substring(@prevstack,2,100000)+' '+convert(varchar,datediff(ms,@prevt,@t))
set @prevt=@t
set @prevstack=@stack
    FETCH NEXT FROM my_cur INTO @r, @class, @t, @lev, @obj
  END
  CLOSE my_cur
  DEALLOCATE my_cur
GO
Data Generation
Now run the stored procedure flame with the following parameters:
- trace table name
- name of a topmost (NestLevel=1) stored procedure, and entry tot he whole execution tree. . Name is specified without [] and schema name, for [dbo].[myProc] specify just myProc
- 3rd parameter is optional, by default it is 0. It allows you to choose a particular execution if more than one execution is recorded.
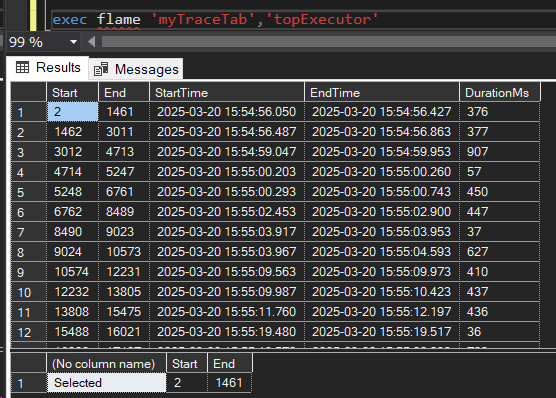
Example:
The first result set displays all found executions of the specified stored procedure, RowNumber range, time range and duration in milliseconds.
If we want to plot a particular execution (not the very first one, which is a default), in 3rd parameter specify the starting RowNumber. For example, for the 9th execution specify value 10574
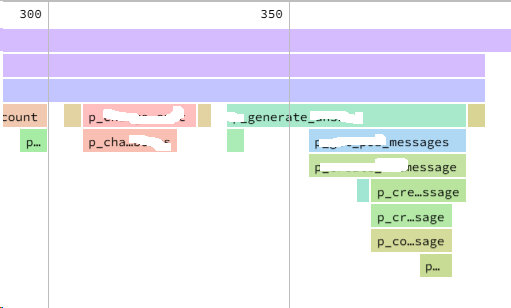
Plotting a diagram
When everything is ready, check the Messages tab and copy all text from there into a text file, removing 'completion time' text at the very end.
Then go to the site https://www.speedscope.app and upload your text file. Enjoy.
-
Thanks for posting your issue and hopefully someone will answer soon.
This is an automated bump to increase visibility of your question.
Viewing 2 posts - 1 through 2 (of 2 total)
You must be logged in to reply to this topic. Login to reply