Azure Analysis Services Memory Usage
-
Hi there.
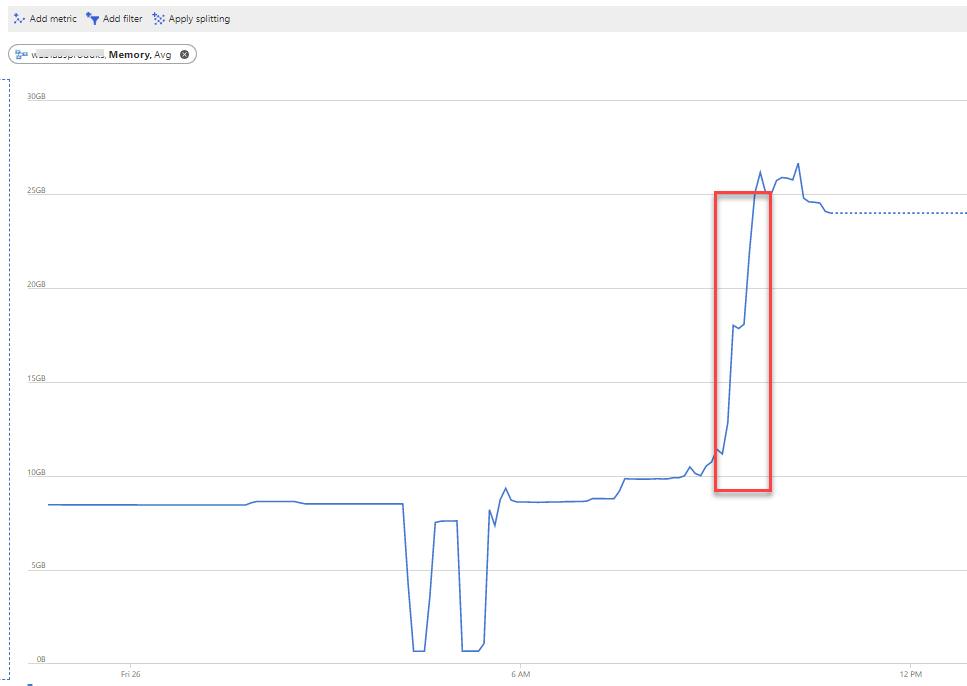
I'm trying to identify what users or processes/queries are consuming the cube server memory. An example is seen here from the azure portal metrics graph. I know you can do the 'discover sessions' in management studio but all those metrics don't particularly help much. Does anyone know a good tool that can provide clear answers?
The end result is that I want to identify what's causing this large spike, and why wouldn't that memory be released after they've run the query anyway? Does AS hold that data in memory until such time that a user closes their Excel file or Power BI report?

Any direction would be much appreciated.
Thanks.
-
Thanks for posting your issue and hopefully someone will answer soon.
This is an automated bump to increase visibility of your question.
-
I'd try setting up a Profiler or ExtendedEvent session to detect what activities/queries are occurring at your memory spikes. Memory goes up during processing as copies of data are kept so server can continue answering requests. Calculated columns on large fact tables are another culbrit, and of course, it could be a "rogue" query. This article by Phil Seamark shows how set set up a Profiler trace, just be sure to turn off when done as they add more load to server than Extended Events. https://dax.tips/2021/02/15/visualise-your-power-bi-refresh/
Viewing 3 posts - 1 through 3 (of 3 total)
You must be logged in to reply to this topic. Login to reply