Average in a Matrix
-
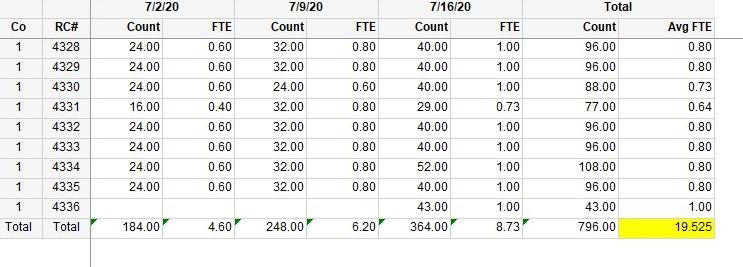
Hello I'm using the Matrix Wizard and everything is working right except one total that I modified. See image:

The detail columns total at the bottom and along the row without any problem. But in my last column 'Avg FTE' I'm trying to get an average. The average works across the row, but not at the very bottom, highlighted in yellow.
If I use '=Avg(Fields!FTE.Value)' it averages the column and not the bottom row of FTE Totals. Here I used Sum,
How do I average the bottom FTE totals?
Thank you for any help,
-
What value do you expect to get when you sum up all of the FTE values? 19.525 is what you would get. If you take the average of all of the FTE values, you will get the average of them. What it sounds like what you want is the average of the total FTE's summed by month, correct?
To get this, it is surprisingly easy actually, that is, if my assumption is correct. How many date values are you going to have? Is it consistently 3 (7/2/20, 7/9/20, 7/16/20) as in your screenshot OR is it variable? If it is consistently 3, then take the sum of FTE and divide by 3. If it is not consistently 3, you would need to take the sum of FTE and divide by the distinct count of dates. That is essentially all that the AVG function is doing - SUM/COUNT. You can verify this pretty easily too. Pick row 1 - the FTE values are 0.6, .08 and 1.0. Sum those together and you get 2.4. We had 3 values, so divide by 3 and you get 0.8. Go down to a more interesting one like row 4 and you have 0.4, 0.8 and 0.73. Sum those together and you get 1.93. Divide by 3 and you get 0.64. technically, 0.6433333333333333333333333333 but your results appear to be rounding to 2 decimal places, so that becomes 0.64.
The row that looks like an outlier is that last row (RC# 4336) but it really isn't. you have 1 value and it is 1.00. 1/1=1. The other values are NOT 0, they do not exist so you can't sum them and thus you don't divide by them either.
TL;DR - do a SUM divided by COUNT or '=SUM(Fields!FTE.Value)/COUNT(Fields!FTE.Value)'. If you always have 3 dates, then I'd do a divide by 3 to save the calculation that needs to be done (the COUNT), but that is just me.
The above is all just my opinion on what you should do.
As with all advice you find on a random internet forum - you shouldn't blindly follow it. Always test on a test server to see if there is negative side effects before making changes to live!
I recommend you NEVER run "random code" you found online on any system you care about UNLESS you understand and can verify the code OR you don't care if the code trashes your system. -
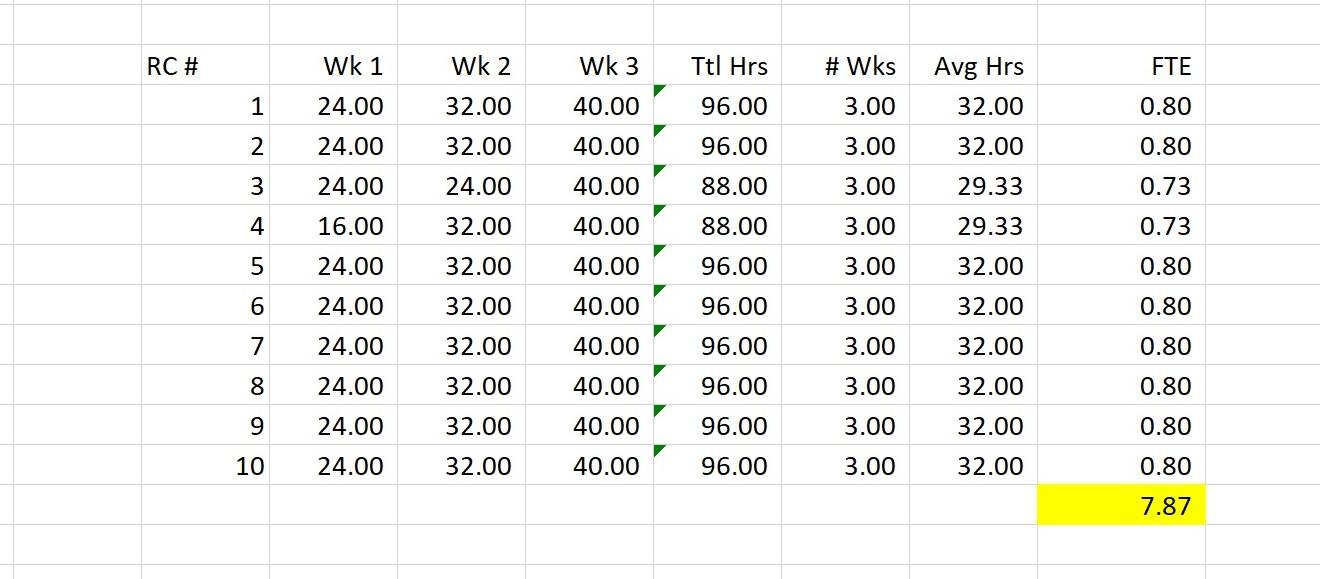
The example I get is horrible, I should redo the thread. Sorry about that. Let me try this.
This is closer to what I want. In yellow I want the average of the FTE column which is an expression not actual table data. If it was not an expression it would be easy.
I'm stuck.
-
So, if I understand what you have properly, you don't have a "Fields!FTE.Value" that you can use to calculate the AVERAGE or the SUM?
I think the logic will be similar still... you are summing up all of your FTE calculations and dividing by the number of weeks. Not sure what your "FTE" calculation is there, but you have the number of weeks and whatever that calculation works out to be, just do a SUM on the calculation and divide by the #Wks value. If I am guessing your FTE calculation, I would say it is something like the Avg Hrs/40.00, right? If so, the calculation for that average will be something like:
=SUM((Fields!AvgHrs.Value)/40.00)/MAX(Fields!#Wks.Value)
right? if AvgHrs is a calculation as well, can you do us a favor and put in a screenshots the SOURCE DATA including field names and none of the calculated stuff and confirm if the calculations for FTE I mentioned above are accurate?
It is really hard to help when the goal keeps changing 🙂
The above is all just my opinion on what you should do.
As with all advice you find on a random internet forum - you shouldn't blindly follow it. Always test on a test server to see if there is negative side effects before making changes to live!
I recommend you NEVER run "random code" you found online on any system you care about UNLESS you understand and can verify the code OR you don't care if the code trashes your system. -
You're right, and I do apologize. I'm a little confused as to how to ask what I need. I'll see if I can get some data, but first how about this:
TltHrs: =Sum(Fields!Hours.Value) - This works fine and totals at the bottom
# Wks: =Count(Fields!PREndDate.Value) - Doesn't need any totals
FTE: =Iif(Sum(Fields!Hours.Value)/Count(Fields!PREndDate.Value)/40>1,1,Sum(Fields!Hours.Value)/Count(Fields!PREndDate.Value)/40)
I can't use the total hours at the bottom because this has to calculate for each record, and some have different week counts. Also FTE is calculated on an individual basis. If I could get the column FTE (which is calculated as above) I'd be set.
I'm trying not to add aggregated fields to SQL for Hours, Weeks, and Avg Hours. That give me an increasing number which I could use in SSRS using =Last(). But I don't think this totals at the bottom either.
-
Yeah, if you could calculate those values on the SQL side, this would be easy. But I enjoy a challenge!
I see where it gets difficult though - the divisor is going to be 1, 2, or 3 so you can't just sum up all of the Hours, divide by the number of weeks then divide by 40.
and you can't just use that same FTE calculation for the total FTE as you are then summing up ALL of the hours and dividing that by the number of rows divided by 40. it is CLOSE but not quite...
I created a quick and dirty sample report with the following data set so I can try to figure this out:
SELECT
1AS [RC]
, 'WK1' AS [Header]
, 10AS [Hrs]
UNION
SELECT
1AS [RC]
, 'WK2' AS [Header]
, 20AS [Hrs]
UNION
SELECT
1AS [RC]
, 'WK3' AS [header]
, 30AS [Hrs]
UNION
SELECT
2AS [RC]
, 'WK1' AS [Header]
, 10AS [Hrs]
UNION
SELECT
2AS [RC]
, 'WK2' AS [Header]
, 20AS [Hrs]
UNION
SELECT
2AS [RC]
, 'WK3' AS [header]
, 30AS [Hrs]
UNION
SELECT
3AS [RC]
, 'WK1' AS [Header]
, 10AS [Hrs]
UNION
SELECT
3AS [RC]
, 'WK3' AS [header]
, 50AS [Hrs];
If anyone else wants to give it a shot, create a matrix report with the above query, set the column RC as the rows, header as the columns and Hrs as the data.
This is an interesting problem... and it should be solvable!
The above is all just my opinion on what you should do.
As with all advice you find on a random internet forum - you shouldn't blindly follow it. Always test on a test server to see if there is negative side effects before making changes to live!
I recommend you NEVER run "random code" you found online on any system you care about UNLESS you understand and can verify the code OR you don't care if the code trashes your system. -
The TSQL didn't work. The report can't do a double aggregate like Sum(Last()).
You're code is awesome for testing. I should have thought of this. My fingers are crossed and I'm hoping to find a way to total a calculated column.
P.S. I also tried =RunningValue() and couldn't get that to calculate correctly.
-
Did some testing and digging on my end and best I can figure out is that you would need to either:
A - do calculations in your SQL query
B - create some custom code for it
As a challenge to myself, I went with option B as I've never done custom code inside SSRS before. Turns out it is pretty easy (if you know VB.NET). But for this particular case, it is quite easy.
Steps:
1- Go to the report properties
2- Select the Code tab
3- enter the following code into the Code tab:
public dim totalFTE = 0
public dim WorkHours = 40

public function CalculateFTE (TotalHours As Integer, Weeks As Integer) As Double
dim result As Double
result = TotalHours/Weeks/WorkHours
If (result > 1)
result = 1
end if
totalFTE = totalFTE + result
return result
end function
Feel free to rename any variables or functions as you see fit, but make sure that you remember that you changed them as they will be used later. Also, WorkHours could be made private, I just had it public as I wanted to see it in the report as I was calculating things out.
4- change your FTE calculation to:
=Code.CalculateFTE(SUM(Fields!Hours.Value),COUNT(Fields!PREndDate.Value))
5 - the last step is that total calculation. The code for that bad boy is:
=Code.totalFTE/COUNTDISTINCT(Fields!RC.Value)
The last step is calculating the average. totalFTE contains the SUM of the FTE values calculated above and we want to get the average, so we just need to count the number of distinct RC values. Alternately, you could modify the code to include a "call count" which would be declared at the top below the totalFTE value, as public and an integer with a starting value of 0. Then each time the function is called, you increment it by 1 and then at the end, instead of doing that COUNTDISTINCT in step 5, you divide by the counter you variable you created. If you have a very large data set, the counter variable will likely be faster at the cost of a TINY bit of RAM.
Does that help?
EDIT - just wanted to confirm that this is required to be SSRS 2005? I did my testing in SSRS 2016. If it needs to be 2005, I am not confident that the above will work.
Also, if SQL SERVER is new enough, you could use LEAD to calculate your FTE value on the SQL side. My thought here is you do a CASE with a LEAD to check if the next row ordered by the week number ascending has the same RC value. If true, then 0, else (SUM(hours) OVER (PARTITION BY RC))/(COUNT(hours) OVER (PARTITION BY RC))/40. Then on the report side, you can do a SUM of the FTE to get the FTE per RC and do a SUM of the FTE divided by a COUNTDISTINCT on the RC column.
Problem comes in when you have an older version of SQL Server and it doesn't have LEAD. In that case my first thought on how to handle it is to create a CTE to calculate out the max week number (essentially, WITH data AS (SELECT *, MAX(week#) AS MAXWEEK OVER (PARTITION BY RC) FROM <table>)) and then in the final select do a CASE WHEN week# = MAXWEEK THEN (SUM(hours) OVER (PARTITION BY RC))/(COUNT(hours) OVER (PARTITION BY RC))/40 ELSE 0 END AS FTE. Then same steps on the report side - you can do a SUM of the FTE to get the FTE per RC and do a SUM of the FTE divided by a COUNTDISTINCT on the RC column.
The above is all just my opinion on what you should do.
As with all advice you find on a random internet forum - you shouldn't blindly follow it. Always test on a test server to see if there is negative side effects before making changes to live!
I recommend you NEVER run "random code" you found online on any system you care about UNLESS you understand and can verify the code OR you don't care if the code trashes your system. -
The code in the report worked awesome. Thanks. But I did run into a problem since it had more that one group. My fault, I left it out. I like the solution of using SQL and a report calc. It seems a little more functional in the long run, this is going to take a bit more test just for me to understand. But I enjoy the challenge and need the experience.
Thank you for your help. I was really stuck and this was great.
Thanks again.
Viewing 9 posts - 1 through 9 (of 9 total)
You must be logged in to reply to this topic. Login to reply