Welcome to a new recipe of this Extended Events cookbook! You will find the first blog post of the series here and you can browse all recipes with the xesmarttarget tag on this blog.
The problem
The idea comes from a blog post by Brent Ozar about “How to Find Out Whose Queries are Using The Most CPU“. Brent uses the Resource Governor to detect who’s using the CPU. That’s an interesting approach, but you can do the same more efficiently with XESmartTarget.
Analyzing a workload means capturing all the queries on a server, categorize them by application name, database name and login name, and creating samples at regular intervals, in order to describe the behavior of the workload over time, let’s say every one minute.
The session
The events that you need this time are rpc_completed and sql_batch_completed. These two events are enough to describe the workload. Here is what the session script looks like:
IF NOT EXISTS ( SELECT * FROM sys.server_event_sessions WHERE name = 'Recipe08')

CREATE EVENT SESSION [Recipe08] ON SERVER
ADD EVENT sqlserver.rpc_completed(
    ACTION(
        package0.event_sequence,
        sqlserver.client_app_name,
        sqlserver.client_pid,
        sqlserver.database_name,
        sqlserver.nt_username,
        sqlserver.server_principal_name,
        sqlserver.session_id
    )
    WHERE ([package0].[equal_boolean]([sqlserver].[is_system],(0)))
),
ADD EVENT sqlserver.sql_batch_completed(
    ACTION(
        package0.event_sequence,
        sqlserver.client_app_name,
        sqlserver.client_pid,
        sqlserver.database_name,
        sqlserver.nt_username,
        sqlserver.server_principal_name,
        sqlserver.session_id
    )
    WHERE ([package0].[equal_boolean]([sqlserver].[is_system],(0)))
)
GO

IF NOT EXISTS ( SELECT * FROM sys.dm_xe_sessions WHERE name = 'Recipe08')
    ALTER EVENT SESSION Recipe08 ON SERVER STATE = START;
XESmartTarget
This is what the configuration looks like:
{
    "Target": {
        "ServerName": "$ServerName",
        "SessionName": "Recipe08",
        "FailOnProcessingError": false,
        "Responses": [
            {
                "__type": "GroupedTableAppenderResponse",
                "ServerName": "$ServerName",
                "DatabaseName": "XERecipes",
                "TableName": "Recipe_08_WorkloadAnalysis",
                "AutoCreateTargetTable": false,
                "OutputColumns": [
                    "snapshot_id AS CONVERT(SUBSTRING(CONVERT(collection_time,'System.String'),1,16),'System.DateTime')",
                    "client_app_name",
                    "server_principal_name",
                    "database_name",
                    "SUM(cpu_time) AS tot_cpu",
                    "SUM(duration) AS tot_duration",
                    "SUM(logical_reads) AS tot_reads",
                    "SUM(writes) AS tot_writes",
                    "COUNT(collection_time) AS execution_count"
                ],
                "Events": [
                    "rpc_completed",
                    "sql_batch_completed"
                ]
            }
        ]
    }
}
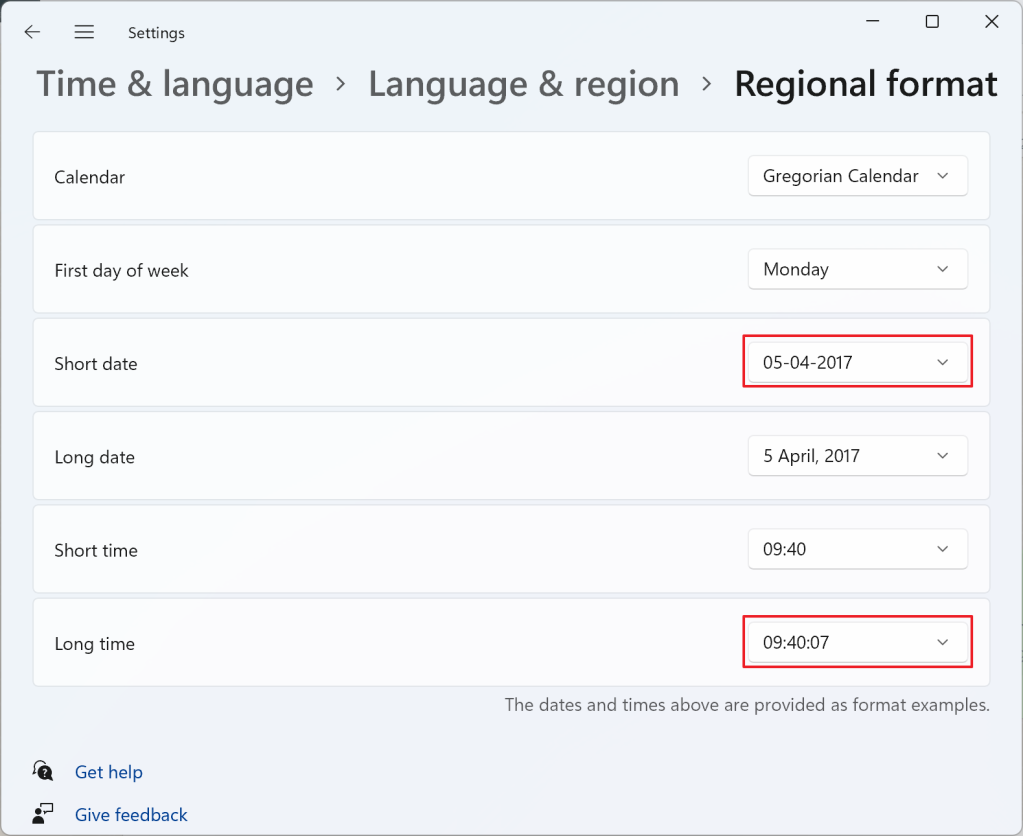
We used the GroupedTableAppender before, but this time we are grouping data using an Expression Column as part of the GROUP BY columns, in order to get a date column with precision up to the minute, to use as a snapshot_id. The expression converts the column “collection_time” (it’an automatic column, added by XESmartTarget to all the events captured) from DateTime to String, removing the last two digits (the seconds). The conversion depends on a weird combination of the short date and long time formats:

In this case, the snapshot_id will be in the format dd-MM-yyyy HH:mm:ss, so taking the first 16 characters, as the SUBSTRING function here does, returns dd-MM-yyyy HH:mm, for instance 18-02-2022 10:15. If you’re using a different format, make sure you’re changing the expression accordingly. Converting it back to System.DateTime ensures that you get a proper datetime2 column that you can sort on.
Before starting XESmartTarget, you’d better create the target table manually:
CREATE TABLE [dbo].[Recipe_08_WorkloadAnalysis](
[snapshot_id] [datetime2](7) NULL,
[client_app_name] [nvarchar](255) NULL,
[server_principal_name] [nvarchar](128) NULL,
[database_name] [nvarchar](128) NULL,
[tot_cpu] [bigint] NULL,
[tot_duration] [bigint] NULL,
[tot_reads] [bigint] NULL,
[tot_writes] [bigint] NULL,
[execution_count] [bigint] NULL,
CONSTRAINT UQ_Recipe_08_WorkloadAnalysis
UNIQUE (snapshot_id, client_app_name, server_principal_name, database_name)
)
Now that the table is ready, you can save the configuration file and start XESmartTarget:
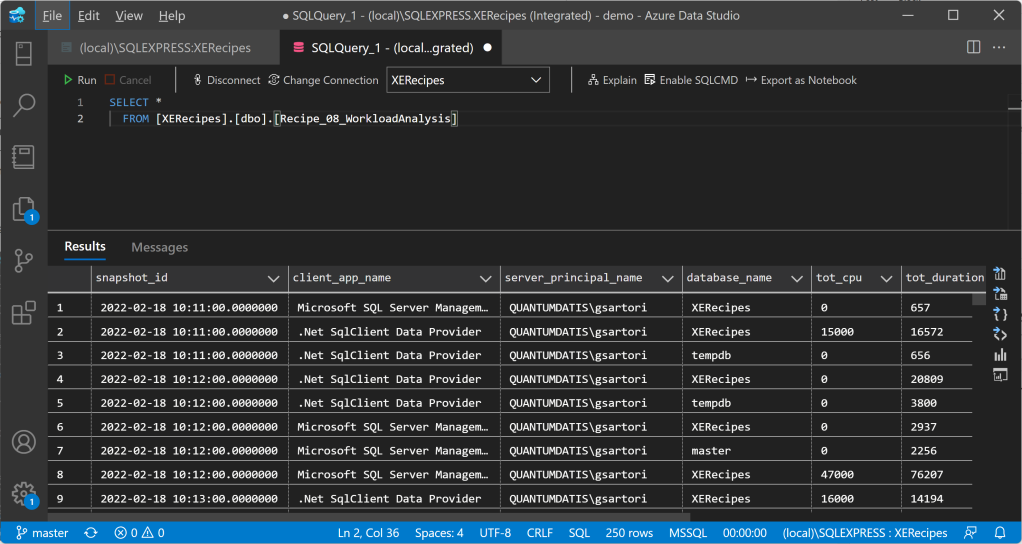
"%ProgramFiles%XESmartTargetxesmarttarget.exe" --File c:tempRecipe_08_WorkloadAnalysis.json --GlobalVariables ServerName=(local)SQLEXPRESSLet’s leave this running for a while and have a look at the data in the target table:

To answer the question in Brent’s post, Whose Queries are Using The Most CPU? Let’s find out! Turns out it’s me (surprise!):

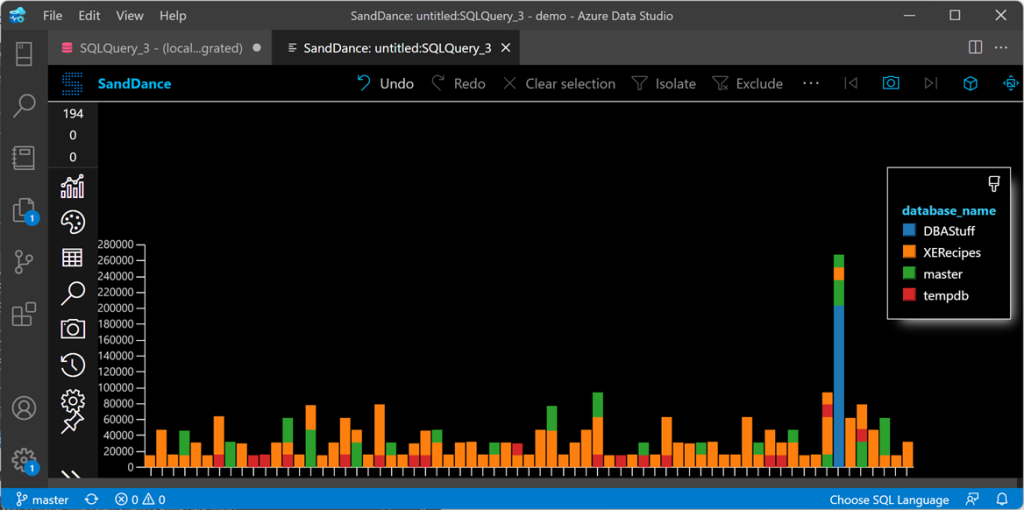
Not only I can analyze the workload as a whole, but I can also plot cpu usage by database or login or application in a chart like this:

Well, maybe Azure Data Studio is probably not the best tool for the job, but you can use something like Grafana to plot the data.
Recap
GroupedTableAppenderResponse is a super powerful tool! It can group on Expression Columns and can be incredibly helpful when you have to summarize event data over time.
In the next recipe we will see how to take GroupedTableAppenderResponse to the next level and simulate what Query Store does (especially useful if you’re not on 2016 or later). Keep an eye on the XESmartTarget tag!

