In a previous blog post, I showed you how to use WorkloadTools to replay a workload in two different scenarios. However, there is a third scenario that is worth exploring: the real-time replay.
Before we jump to how, I’d better spend some words on why a real-time replay is needed.
The main reason is the complexity involved in capturing and analyzing a workload for extended periods of time. Especially when performing migrations and upgrades, it is crucial to capture the entire business cycle, in order to cover all possible queries issued by the applications. All existing benchmarking tools require to capture the workload to a file before it can be analyzed and/or replayed, but this becomes increasingly complicated when the length of the business cycle grows.
The first complication has to do with the size of the trace files, that will have to be accommodated to a disk location, either local or remote. It is not reasonable to expect to capture a workload on a busy server for, let’s say two weeks, because the size of the trace files can easily get to a few hundred GBs in less than one hour.
The second complication has to do with the ability of the benchmarking tools to process the trace files: bigger and more numerous files increase enormously the chances of breaking the tools. If you ever captured a big workload to a set of trace files to feed it to ReadTrace, you probably know what I’m talking about and chances are that you witnessed a crash or two. If you tried it with DReplay, you now probably have an ample collection of exotic and unhelpful error messages.
In this context, being able to process the events as soon as they occur is a plus, so that storing them to a file of any type is not needed. This is exactly what WorkloadTools does with the real-time replay feature.
Performing a real-time replay
All the considerations made for replaying a saved workload also apply to this scenario. First of all, you will need to set up a target environment that contains an up to date copy of the production database. Log shipping is a great tool for this: you can restore a full backup from production and restore all logs until the two databases are in sync. Immediately after restoring the last log backup with recovery, you can start the capture and replay on the production server.
The .json file for this activity will probably look like this:
{
    "Controller": {

        "Listener":
        {
            "__type": "ExtendedEventsWorkloadListener",
            "ConnectionInfo":
            {
                "ServerName": "SourceInstance"
            },
            "DatabaseFilter": "YourDatabase"
        },

        "Consumers":
        [
            {
                "__type": "ReplayConsumer",
                "ConnectionInfo":
                {
                    "ServerName": "TargetInstance",
                    "DatabaseName": "YourDatabase"
               }
            },
            {
                "__type": "AnalysisConsumer",
                "ConnectionInfo":
                {
                    "ServerName": "AnalysisInstance",
                    "DatabaseName": "SqlWorkload",
                    "SchemaName": "baseline"
                },
                "UploadIntervalSeconds": 60
            }
        ]
    }
}
On the target server, you can use SqlWorkload again to capture the performance data produced by the replay, using a .json file similar to the one used when analyzing the replay of a saved workload:
{
    "Controller": {
        "Listener":
        {
            "__type": "ExtendedEventsWorkloadListener",
            "ConnectionInfo":
            {
                "ServerName": "TargetInstance",
                "DatabaseName": "YourDatabase"
            }
        },

        "Consumers":
        [
            {
                "__type": "AnalysisConsumer",
                "ConnectionInfo":
                {
                    "ServerName": "AnalysisInstance",
                    "DatabaseName": "SqlWorkload",
                    // different schema from SqlWorkload 1
                    "SchemaName": "replay"
                },
                "UploadIntervalSeconds": 60
            }
        ]
    }
}
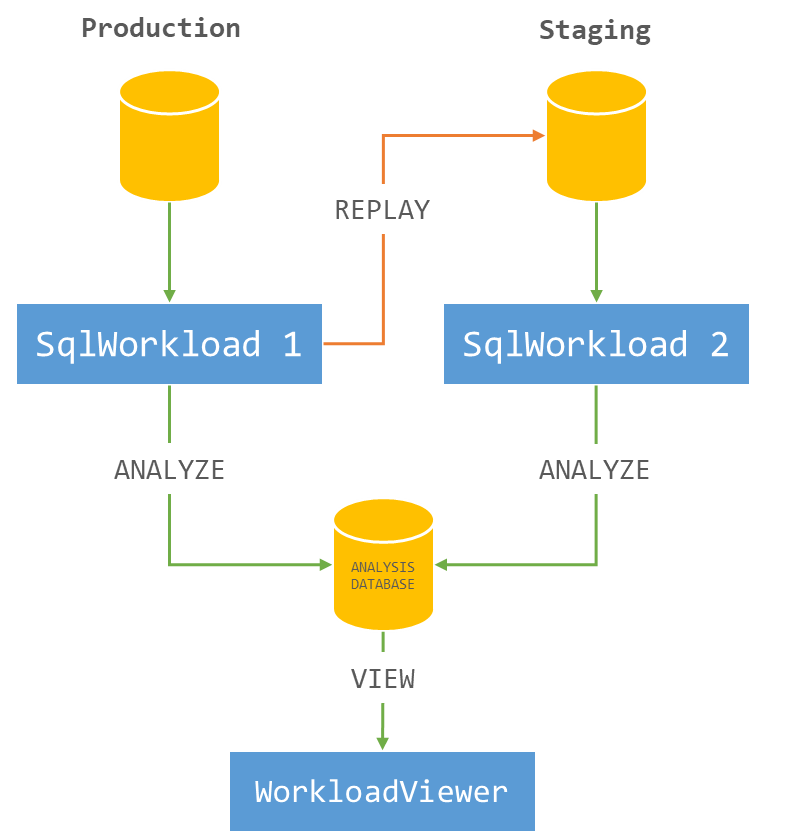
The overall architecture of the real-time replay looks like this:

It is crucial to start both instances of SqlWorkload at the same time, as the time dimension is always measured as the offset from the start of the analysis: starting both instances at the same time ensures that the same queries get executed around the same offset, so that you can compare apples to apples.
It is also extremely important to make sure that the target environment can keep up with the workload being replayed, otherwise the number of queries found in the same interval will never match between the two environments and the two workloads will start to diverge more and more. You can observe the data in WorkloadViewer while is gets written by the two analysis consumers and you can compare the number of batches per seconds to make sure that the target environment does not get overwhelmed by the workload. To refresh the data in WorkloadViewer, simply press F5.
The analysis and comparison of a real-time replay is not different from a deferred replay and you can use the same tools and apply the same considerations to both situations.
The interesting part of a real-time replay is the ability to perform the replay for extended periods of time, without the need to store the workload data to any type of intermediate format and without the need to analyze the workload data as a whole before you can proceed with the replay. The possibilities that this approach opens are really interesting and can be outside the usual scope of benchmarking tools.
As an example, you could decide to have a staging environment where you want to test the performance impact of new implementations directly against a production workload, gaining immediate insights regarding performance and catching runaway queries before they hit production. The traditional approach to this problem has always been based on test harnesses that simulate the critical parts of the workload, but building and maintaining these tools can be time consuming. With WorkloadTools you can measure the performance impact of your changes without having to build new tools and you can focus on what matters to you the most: your business.

