

Recently I had an interesting use case where I had to a compound calculation in Power BI. You can compound an interest rate for example, where you get a certain rate on your savings. Let’s say 1% (which is at the time of writing ridiculously high, but bear with me). After 1 year, you get 1% interest on your money. If you leave that (small) amount of money on your savings account, you’ll get 1% after another year on the original amount + the interest amount of the previous year. This means you’re money grows exponentially (sounds more exciting than it is in reality).
In Belgium, wages are indexed (as many other things, such as rent or consulting fees). Each year, many employees in Belgium get an automatic “raise” when their wages are indexed (it’s a bit of an oversimplification, but that’s okay for this blog post). This means higher wages get more increase. In this blog post, we’re going to take a fictional wage and create a what-if scenario in Power BI to simulate how an index can impact a wage (the actual use case was revenue btw).
I’m using the following sample data:
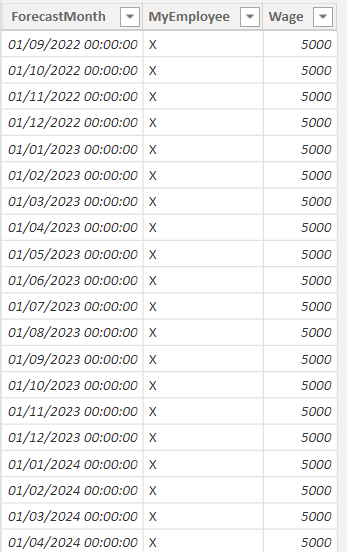
This is generated with the following SQL query:
SELECT TOP (20)
ForecastMonth = DATEADD(MONTH,ROW_NUMBER() OVER (ORDER BY (SELECT NULL))-1,'2022-09-01')
,wage.MyEmployee
,wage.Wage
FROM sys.all_columns a
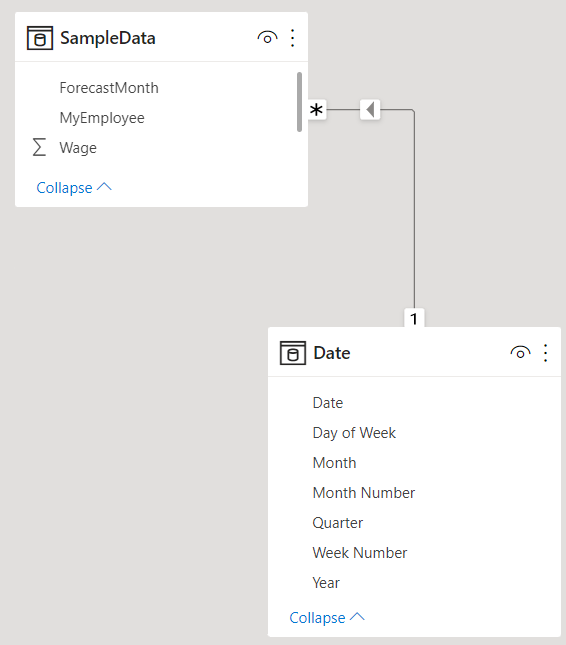
CROSS JOIN (SELECT MyEmployee = 'X', Wage = 5000.0) wage;In the model, we also have a date dimension. You can easily generate one in Power Query using the script from Devin Knight. Link it to the SampleData table. I also created a measure Wages, which is simply SUM(Wage).
In Power BI Desktop, we can create a what-if parameter in the Modeling tab:
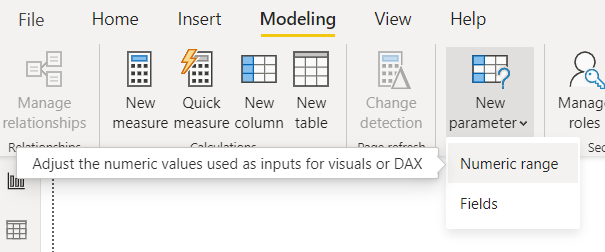
Choose the Numeric Range option, which will take you to the following dialog:
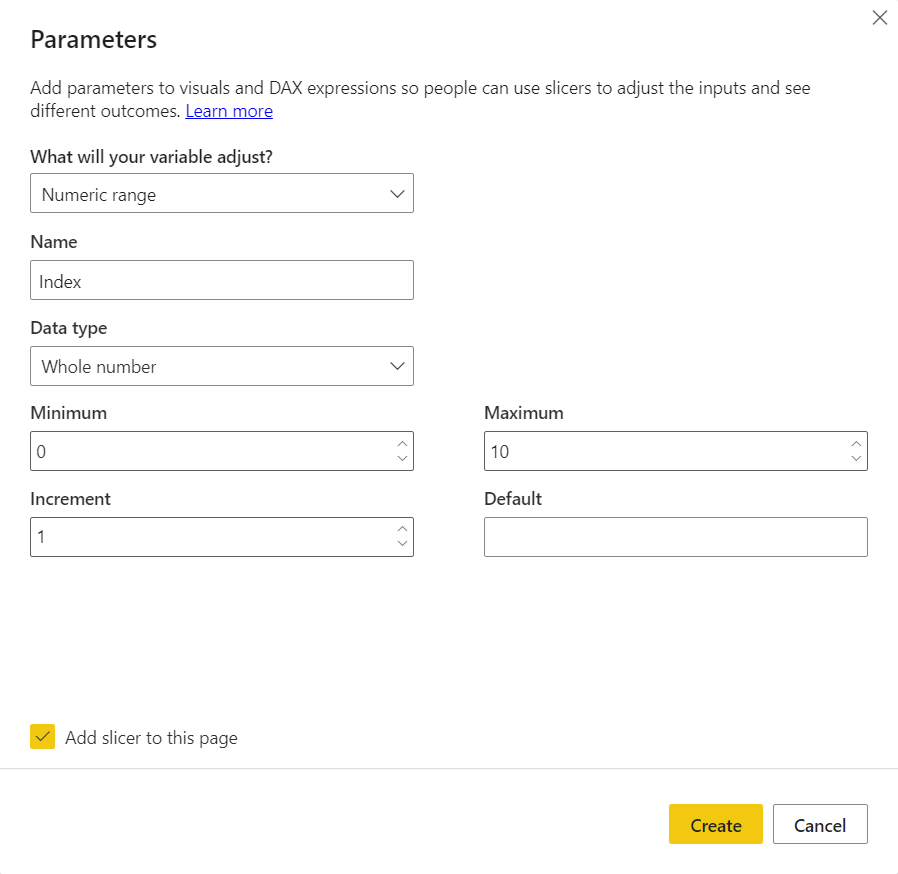
I choose for a numeric range between 0 and 10, which in normal cases should be fine. However, this year, the index is for the moment a whopping 10.47% (a couple of years back we even had a negative index!). Always be careful with assumptions 
Power BI will create a table for you, along with a slicer and a measure telling you which value is selected in the slicer:
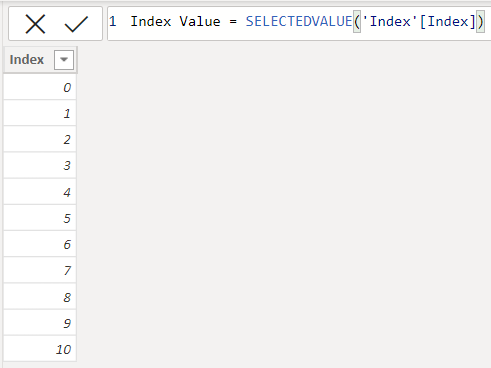
Once we have this, we can create a measure using the index value, and the wages.
Wage Indexed =
VAR selectedyear = SELECTEDVALUE('Date'[Year])
VAR currentyear = 2022 // this might need to be calculated
VAR rate = DIVIDE([Index Value],100)
RETURN [Wages] * POWER((1 + rate),selectedyear-currentyear)
We can get value of year used in the filter context by using SELECTEDVALUE. This means if in a chart the line is at the date of 2023-10-01, we will get 2023. In the variable currentyear, we store 2022. This is hardcoded, so you might want to replace this with something that matches your use case, such as YEAR(TODAY()) for example. Or you can calculate the minimum year found in the sample data table. For the rate, we take the current index value (which also uses SELECTEDVALUE behind the scenes) and we divide this by 100 to get an actual percentage. Finally, we calculate the following formula:
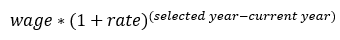
This will give as a compound rate. For each year further in the future, we get more value out of our rate. Let’s create a chart to illustrate our use case.
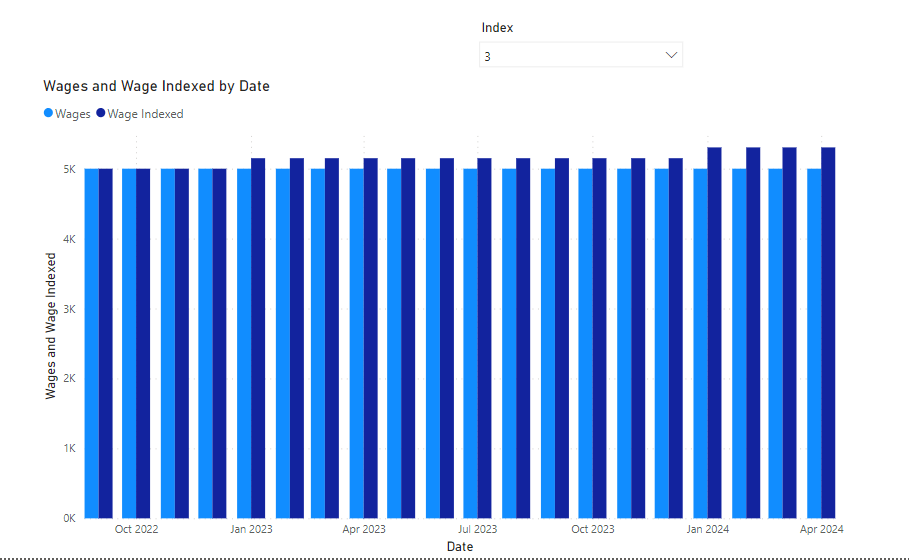
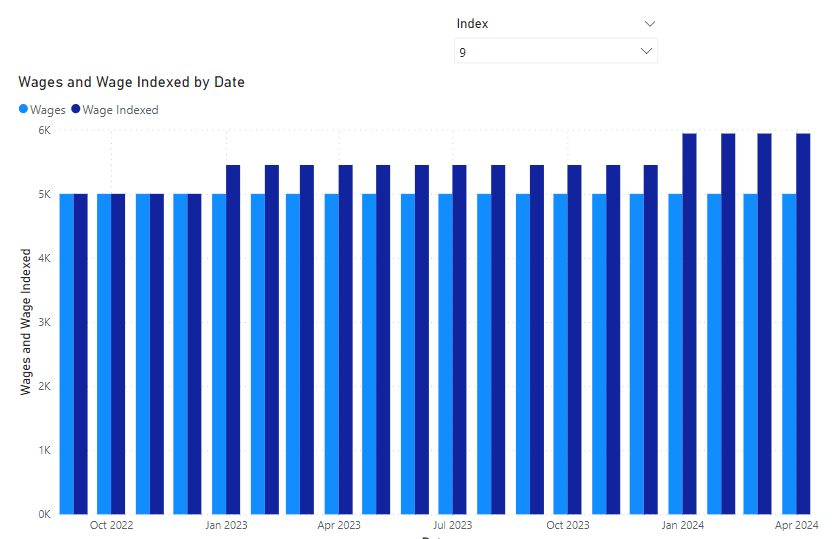
It’s easy to see that the indexed wage gets bigger every year. If we select a higher value for the index, the difference will become even larger.
Another use case you can implement with this formula, is for example “what if we raise our prices with x%? How will this impact revenue?”.
A more complex case is where you want to use a different rate for every year. Matt Allington explains how you can do this in his blog post Compound Growth using DAX.
The post How to Calculate Compound Rate in Power BI first appeared on Under the kover of business intelligence.