The
Complaint(s)
When I was young, I went to nursing school. In school, we were taught that in order to come
up with a proper diagnosis, the doctor first had to get a patient history. Based on what that revealed, the appropriate tests
were run, labs were reviewed and a theory of what was wrong was formulated. The doctor would comb the literature and consult
colleagues and experts if needed until a diagnosis was made. When the doctor arrived at a diagnosis, he or
she found that in many cases, the cure was documented and it was usually a
matter of following standardized steps of care while carefully monitoring the
patient to prove that they were back on the road to health.
So now, all these years later, instead of being a nursing
student, I’m basically a database doctor, and this should all be analogous,
right?
Yes, it should. No, it wasn’t.
I had a history of the servers and workloads in question,
and a list of the problems that had come up.
The problem was, I couldn’t find good documentation of similar cases
anywhere, much less a consult for a diagnosis or a solution. So, now what?
Now, I decided, I go back to the days of experimental medicine (I mean, database doctoring).
History
The first step was to go back and review what I had learned so far. I had previously done some limited test runs on our current SAN environment that ran somewhat slower than the real-time trace, but nothing approaching what I had just seen on the test SAN. As I mentioned in my previous blog, when I was first getting familiar with the DRU, I had tested with several different types of architecture: one where the controller and the client server were on the same instance, and another where the client and the target servers were on the same instance, and a third with the default architecture of one controller: one client: one target. I even tried making the controller, client and target the same server. There was no noticeable difference in replay times in those initial tests. Architecture didn’t seem to be the issue.
Next, I looked at the quality and quantity of the workloads.
I had two completely preprocessed workloads to work with: The controlRun and the HeavyIORun. In my controlRun
testing, I’d used a number of scripts for my trace, utilizing some resource-intensive
queries like CHECKDB, and a script using a nested cursor– but nothing that
actually modified data. The HeavyIORun,
however, processed millions of rows of data at a time and modified it. I had been
comparing apples to watermelons. That
would need to be fixed.
I felt convinced that the DRU was dividing replay events up
as evenly as it could to do the second step of preprocessing, but it could only
go as fast as its configuration would allow. It might go pretty quickly with a few hundred
thousand events to divvy up, or even take about 20 minutes for a little over a
million, but clearly, the CriticalSystemProcessingRun (topping out at over 55
million events) had not scaled at all. Given
this, I had to believe that the DRU itself was a bottleneck. That, I could do nothing about.
But how to make the replays go anywhere close to real time…. that was the question to which I had no answer.
Lab Work/Tests
The first step would be to compare the runs in each environment. I had captured the metrics on the test SAN, which was taken down shortly afterward. All future work would have to be done on the existing SAN, with similar (if not more detailed) metrics being recorded.
As I reviewed the initial trace that I had wound up using as
a control, I recalled that I had never done that trace with any intention of
using it for that purpose. It was only done
as a means to get to know the utility and to play around with its capabilities
and quirks. I had wanted something that
I could use as a gauge to give me some idea of how long it might take to do a
replay “for real”. Now, it seemed clear
that while my controlRun might have been interesting (and certainly insightful
for helping to determine how the preprocessing works to divide the workload),
it only served to see if the DRU worked. It wasn’t very helpful in and of itself to
get any idea of how it worked.
I also began to wonder if the fact that my controlRun had
not modified data had anything to do with the replay time. I similarly wondered if filtering the trace
to just one database would have had any effect on the replay.
It was time to come up with a set of better control traces. First, I would need a trace which would cause
physical changes on the server, and as closely as possible, try to match the
HeavyIORun run (since I was able to at least complete preprocessing with that
workload). This was challenging, because
the HeavyIORun process was run by a middle tier and was transparent to me. However, my team had traced part of the
process once while trying to troubleshoot replication issues, so I knew that it
delivered large batches of data in spurts of activity from an outside source. I could roughly mimic the activity by
creating a database (for this, I used Kimberly Tripp’s Credit database,
weighing in at roughly 1.4 GB) and then importing all the data into it from a
copy of the same database on another instance using SSIS. Once the database was
full of data, I would then drop it, recreate it, and reimport the data all over
again. I repeat this process until the trace time was up, which would be for about
the same amount of time as the HeavyIORun trace: 20 minutes. That would
simulate the idea of the bursts of IO from another process and give me some
idea of how the DRU handled it. It also
offered the advantage of using the same repeated activity throughout the trace,
which could help if it hit any bumps in the road on replay. I named this
control process the DMLRun.
To address the question of whether traces that didn’t modify
data would perform better on replay, I needed a process that would run for the
same amount of time as the DMLRun, which didn’t modify any data, but still
generated workload on the server. This process could then be compared to the
DMLRun to see the difference in execution time and preprocessing metrics. To accomplish that, I ran Glenn Berry’s
database-specific diagnostic queries, followed by a CHECKDB of all
databases. I called that trace
LimitedRunNoDML.
The Search for Answers
I duplicated the DRU architecture from the test SAN. I also duplicated the default replay settings.
I decided to begin by addressing the questions of whether a trace that modified no data really ran any faster on replay, or whether filtering the trace made any difference. To do that, I used the LimitedRunNoDML script on our existing SAN. In the first scenario, I would run the script with the trace filtered to just the one database that Glenn’s database-specific queries were hitting, and in the second run, I would run the same script with the default trace (no filters). I hoped that observing the contrast in this controlled trace might provide some insight. At least, it offered ideas.

The second run took about 3 seconds less to complete preprocessing (even though it was now running against the entire server). It also wound up with fewer preprocessed events, but those events took longer to actually replay. I suspect that the change in events could be due to the DRU caching some events that it “knows” that it will reuse. But why did it take almost a minute longer to replay fewer events the second time? And why was the pass rate slightly lower on the second run? Looking through the output files for the second run, I did find a number of interesting entries which I have sampled below (I say interesting, because it obviously knew where the trace was, and because the controller, the client, and myself – the person executing the scripts – were all sysadmin):

Without doing an actual row count of the trace itself as
opposed to the number of replay provider errors that were recorded, it did seem
likely that there were enough occurrences to equate to .03%. It also seemed possible that the “under the
covers” activity that was recorded might at least contribute to the lowered
pass rate and extra execution time. The
reason for the low pass rate was unclear until I did some reading on the SQL
Server Profiler Replay (which is basically a manual version of the DRU, using
the same trace template). Transactional
replication is skipped with this, and the use of linked servers would also have
some implications here.
Still, the trace ran between 2-3 minutes under real time in
both cases, and it didn’t make much of a difference whether the trace was
filtered to one database or not.
Next, I did the DMLRun. I ran the process 10 full times, and was about halfway through the 11th run when the trace stopped. Each completed run imported 1,676,574 rows of data.

This replay was moving in nearly real time until it reached the last 150 events. Then it hung for hour after hour, finally finishing in over 15 hours. I wondered if running it a second time would make any difference. It did. Just not the one I was hoping for:

Something had to give. I was just about out of ideas, until I decided to try changing the DRU settings. I tried changing the sequencing mode from the default of stress to synchronization. Synchronization mode replays events in the same order they occurred (vs. the default stress mode, which follows the sequence used in the StressScaleGranularity setting (which. in my case, was set to the default of “SPID”). There’s a caveat here: Microsoft warns that “if you actually have 8192+ sessions that require synchronization with the 8193rd, 8194th, ….sessions(s) the replay can stall because the 8193rd, 8194th, … session won’t have a replay worker until one of the 8192, previous sessions completes.” I checked my logs to be sure that wouldn’t be an issue for me on the DMLRun replay before I switched the setting.

From 15 hours (on the previous best case run) to 18.5+ hours
to 21+ minutes! This was progress! Had I found the fix? It was tempting to think so.
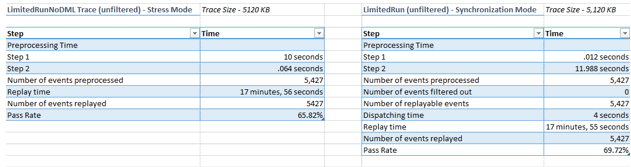
I thought I’d try a comparison of the unfiltered LimitedRunNoDML replay I’d done earlier in stress mode vs. synchronization modes to see if I got the same sort of dramatic results I’d gotten on the DMLRun:

The answer was: not
really. The preprocessing time was
roughly the same; it was just a tradeoff of which step I wanted to spend the
most time on. Still, the replays are
faster than the trace actually took.
Now to test the fix on the HeavyIORun, which was going to take over 12 hours using the default settings on the newer, faster test SAN. Here are the runs in Stress Mode vs. Synchronization Mode:

In this case, using synchronization mode actually takes longer overall, but that is still a huge
improvement over the test SAN, which had projected a 12+ hour run time. Both runs are slightly over the actual trace
time, but by a matter of minutes.
Conclusions
- Running replays on a different SAN environment
presents real performance challenges on replay.
One main difference that must be mentioned between the environments is
that both the CriticalSystemProcessingRun and the HeavyIORun were
application-driven, and the applications were not pointed to the new SAN. In other words, some
processes were done through the application rather than through SQL Server, and
it was impossible to tell what might have been missed. Given another opportunity, I
would request more time for testing. I
would first run the control processes (DMLRun and LimitedRunNoDML), then I
would test to determine whether pointing the applications to the new
environment made a difference, and if so, how much.
- It seems clear that tweaking the configurations
of the DRU can have a real effect on
replay, depending on the workload involved.
However, documentation on the implications of changing the replay
configurations are difficult to find (if they exist at all). It would be helpful if more information on
this was provided for this Microsoft recommended utility, and optimally, a
mechanism embedded within the utility itself in the preprocessing phase to
recommend configuration settings for better replay performance.
- Filtering the trace to just one database vs.
running it wide open on the server seemed to have very little real effect on
replay, aside from allowing for a slightly better pass rate. More testing should be done with different
workloads in the future to provide more confirmation.
- The utility itself has the potential to be a
bottleneck for preprocessing. It does
not scale well during the second phase of preprocessing (although this may well
be unavoidable).
- The pass rate mechanism is unclear unless you
read up on the older Profiler Trace Replay mechanism. The Profiler Trace Replay is basically a
manual version of the DRU. It doesn’t
work with transactional replication (used in both runs), and of course, data
processed over linked servers would have some issues here as well.
- With Profiler traces deprecated, it would be
great to see the DRU work with Extended Events.
- A GUI interface would provide a faster and more
convenient way to run the utility.