

Many people work in a tightly controlled environment. Every change requires a change control form and approval to make a change. In some environments, things are more lax, but you still wish you could tell when certain changes were made. That is even true in some  of those tightly controlled environments. You know what I am talking about. Despite the controls in place there always seems to be some change that is unknown or even some cowboy that makes changes as s/he sees fit and forgets to notify people or follow process.
Then come the times when you are new to an environment and you really need to know some basic information about the servers you have just inherited. Well, truth be told, you don’t necessarily have to be new to a job to inherit some new servers. Sometimes, blackbox servers end up getting dropped into your realm of responsibility.
When you run into something like this, you really need to have some means to figure out what changed, when it changed and who changed it. Having that information as a base, you would then have the tools to inquire as to why it might have been changed. One of the things that would be nice to know is around the trace flags that can be enabled in SQL Server. There are trace flags (or knobs) for so many different things within SQL Server that it would be nice to get a handle on them if they do happen to be enabled or even disabled.
As a DBA in SQL Server, you should know by now that there are multiple different ways to do all sorts of things within SQL Server. Today we will discuss three different methods that you could use to perform this investigation for yourself.
Report Style
Did you know that Management Studio comes with a dashboard report? It does! In that report, one will find a pretty decent amount of overview information as a first pass to get to know your server. If you were to right click the instance within SSMS, you can browse to the Reports/Standard Reports submenus. From there you can select the Dashboard report. The path to the reports is similar to what is displayed in the following screen capture.

The report that is of interest is circled in red in the preceding image.
If you have any trace flags enabled (globally) you can see those listed in the report similarly to the following image:

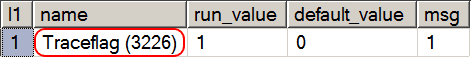
Once again, I have encircled the relevant data in red. From this instance that I queried, I currently have one trace flag enabled. As it stands, this particular trace flag is the one that disables the noise of successful backups from being recorded to your log.
This is one particularly easy method to retrieve that information. A benefit from this method is that you will be able to see some graphs and charts and so forth by using the report.
SQL Query
As logic would dictate, it would seem that we should be able to trap that information through the use of our most frequently used tool – TSQL. Case in point is that the report itself requires the use of TSQL to produce the dataset for the nice display we would see when the report is rendered.
Using similar code to what is used to produce the Dashboard report, we can get a decent understanding of the trace flags that might be employed on your particular instance. Let’s take a quick look at what we could do.
CREATE TABLE #tracestatus(
        TraceFlag nvarchar(40)
,       Status tinyint
,       Global tinyint
,       Session tinyint
);

insert into #tracestatus
exec('dbcc tracestatus')
update #tracestatus
set TraceFlag = 'Traceflag ('+TraceFlag+')'

select 1 as l1
,       TraceFlag as name
,       convert(nvarchar(15), Status) as run_value
,       '0' as default_value
,       1 as msg
from #tracestatus
where Global=1 order by name

GO
As you can see, that code is terribly simple. The crux of the code boils down to a DBCC command to return the results of TRACESTATUS. Granted, this is a bit over the top and designed to dump the data into a table for later consumption (for good reason). You can legitimately get away with simply running DBCC TRACESTATUS. The results of this would produce the following for the same instance of SQL Server shown in the Server Dashboard report we already explored. Those results look like the following.
So far, so good. If I had several trace flags enabled globally on this instance then I would see every single one of them in the result set just displayed. Cool!
To this point, this is wonderful for anything that might be currently enabled on the instance. Should any of those trace flags be disabled shortly after being enabled, or even be disabled months after being enabled but before you run either of the two preceding methods, then you are up a creek without a paddle. That is a problem. How would you trap that cowboy sysadmin or cowboy DBA in that case? Well, you could go with a full blown audit. Or you could try a similar approach but on a somewhat smaller scale.
If you are paying close attention, you are probably thinking to yourself that the query just demonstrated seems more complex than it need be. After all, the documentation for DBCC TRACESTATUS says that I can run that command with a -1 parameter and just have it return the global trace flags. And in the script I am showing, I filter on Global = 1. Well, as it turns out, the -1 option in DBCC TRACESTATUS does not work as documented. The -1 parameter does not return the appropriate result set and that is reproducible. If you were curious, the MSDN reference is here. The use of that parameter value still returns session flags as well.
Extended Event
Oh my, we are talking about something really abstract and difficult now! No, not really. This is a pretty straightforward approach and easy enough to implement. Within XE, there is an event called trace_flag_changed. If you were curious, you could use a query such as the following to find any events that might be related. The key is finding the correct key terms to find what you need/want.
SELECT c.object_name as EventName,o.description as EventDescription
FROM sys.dm_xe_objects o
INNER JOIN sys.dm_xe_object_columns c
ON o.name = c.object_name
and o.package_guid = c.object_package_guid
WHERE object_type='event'
AND c.name = 'channel'
AND c.object_name like '%flag%'
Order By o.package_guid;
Running that query will return just one result. You might find a few more if you expand your search criteria to include the term “flag” within the description field. It’s up to you to explore a bit more. As the description and name imply for this particular event, you can presume correctly that it tracks when a TF is either enabled or disabled (the state of the TF changes). Let’s call this a mini audit for a very targeted type of event.
Knowing the name of the event, let’s go ahead and look at a possible setup for an event session to trap data:
CREATE EVENT SESSION [TrackTFChange] ON SERVER
ADD EVENT sqlserver.trace_flag_changed(
    ACTION (sqlserver.database_name,sqlserver.client_hostname,sqlserver.client_app_name,
            sqlserver.sql_text,
sqlserver.session_id)
    WHERE sqlserver.client_app_name <> 'Microsoft SQL Server Management Studio - Transact-SQL IntelliSense')
ADD TARGET package0.ring_buffer
WITH (MAX_DISPATCH_LATENCY=5SECONDS, TRACK_CAUSALITY=ON)
GO

ALTER EVENT SESSION TrackTFChange
ON SERVER
STATE = START;
GO
This gets us to a point where we can now trap all changes to a trace flag status (enabled/disabled). At this point, a bit of a caution is that the event appears to fire twice for every time it occurs. There is one case where it will not produce a double result for each change. That case happens to be if the TF is already set to the same setting to which you are attempting to change it to. So if it is enabled, trying to enable it again just records one event to fire. However, trying to enable or disable the TF when it is in the opposite state, you will see two occurrences of the event firing. Here is a sample output to help show what happens.
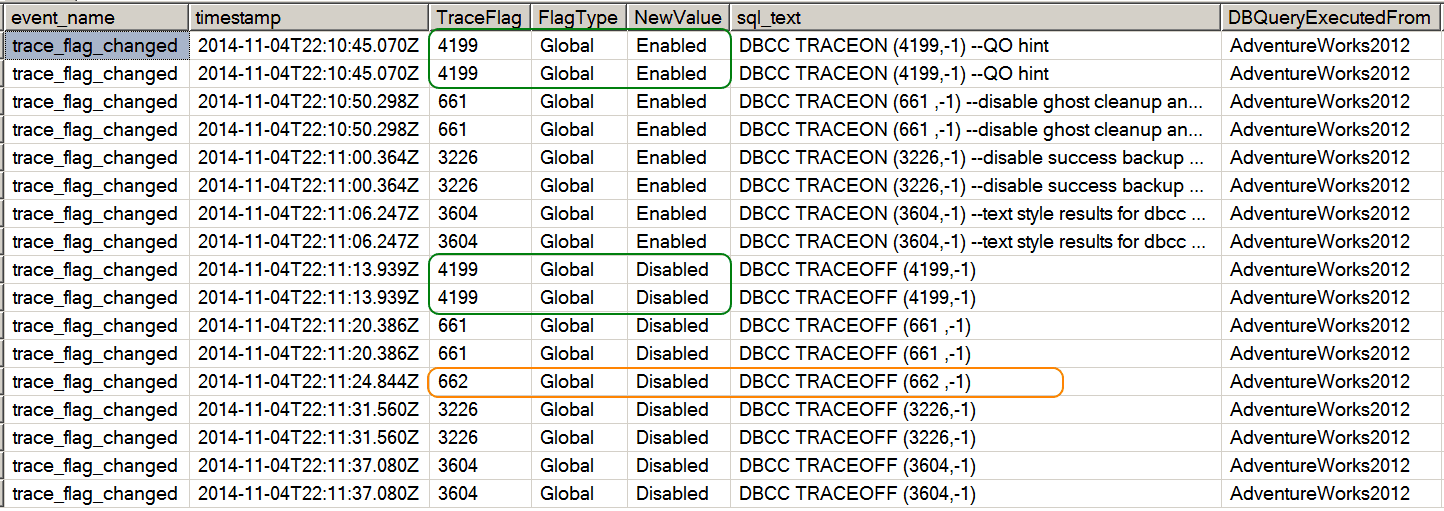
Displayed in the preceding image, you will notice both scenarios. In the scenario where the TF was not enabled, and I attempted to enable it, you will see two entries. And then when I disabled that TF after enabling it, I once again got a double entry. A corresponding example is encircled by the green. Now, when I tried to disable a TF that was not currently enabled, you see there is a single entry. That occurrence is marked via the orange circle.
A problem does present itself here with this result set and the use of XE. How in the heck did I get the results from the XE Session so I could peruse it? Here is a sample script that will help parse this session data.
/* Query the XE */
SELECT
    event_data.value('(event/@name)[1]', 'varchar(50)') AS event_name
,event_data.value('(event/@timestamp)[1]','varchar(max)') as timestamp
    ,event_data.value('(event/data[@name="flag"]/value)[1]', 'bigint') AS TraceFlag
,event_data.value('(event/data[@name="type"]/text)[1]', 'varchar(max)') AS FlagType
,case event_data.value('(event/data[@name="new_value"]/value)[1]','int')
When 0 then 'Enabled'
When 1 then 'Disabled'
END as NewValue
,event_data.value('(event/action[@name="sql_text"]/value)[1]', 'varchar(max)') AS sql_text
,event_data.value('(event/action[@name="database_name"]/value)[1]', 'varchar(max)') AS DBQueryExecutedFrom
,event_data.value('(event/action[@name="client_hostname"]/value)[1]', 'varchar(max)') AS ClientHost
,event_data.value('(event/action[@name="client_app_name"]/value)[1]', 'varchar(max)') AS appname
,event_data.value('(event/action[@name="session_id"]/value)[1]', 'varchar(max)') AS session_id
FROM(    SELECT evnt.query('.') AS event_data
        FROM
        (    SELECT CAST(target_data AS xml) AS TargetData
            FROM sys.dm_xe_sessions AS s
            INNER JOIN sys.dm_xe_session_targets AS t
                ON s.address = t.event_session_address
            WHERE s.name = 'TrackTFChange'
              AND t.target_name = 'ring_buffer'
        ) AS tab
        CROSS APPLY TargetData.nodes ('RingBufferTarget/event') AS split(evnt)
    ) AS evts(event_data)
WHERE event_data.value('(event/@name)[1]', 'varchar(50)') = 'trace_flag_changed'
ORDER BY timestamp asc;
Now isn’t that really helpful?
Conclusion
Today I covered three different means to help isolate the trace flags in use or the changes to the state of those trace flags. This is good information that any DBA should want to know. It is information to help get an understanding of the health and operating environment of your instance. It is also a means to help identify what might be changing under your nose!
For more uses of Extended Events, I recommend my series of articles designed to help you learn XE little by little.
Need a little help with extensive audits of your servers, check out these articles.
![]()