Part I: Capture a Workload
- Make a backup of the database(s) in question, as it will be necessary for the replay.
- Using the TSQL Replay template, fire up Profiler on the client in question, as it has the minimum amount of information needed for the replay. While the DRU does not need to be “on” at this point, it is important to use a server-side trace for the capture (if you’re not sure how to do a server-side trace, there are some good online resources to provide step-by-step instructions).
- Run your workload, using filters (i.e., application, database) if needed.
- Stop the trace either manually or, if you pre-programmed a stop time, automatically.
Part II: Replay the Workload
Warning: The DRU is not Vegas – what happens on the client does not stay on the client! Since it is a physical replay, data can/will be altered on the target server as a result. Thus, this should never be performed in production!
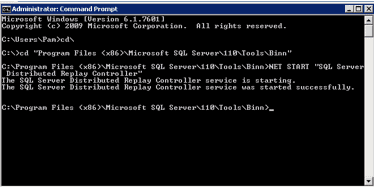
- Start Your Engines. Restore the database(s) to the target server and copy the completed trace to the controller server. When you are ready to begin the replay, start the controller first and then client services (must be performed in that order). While the example below illustrates the use of the command prompt to start the controller service, it could also be done through the Services GUI on the OS.

2. Preprocess the Trace. Once the services are up and running, you will preprocess the trace, which is a two-phase process:
a. The first phase absorbs the data from the trace. The speed at which this occurs depends upon your server specs and configurations. During my testing, I found that the rate of the second step is remarkably consistent and seems to be at least a partial function of the SQL Server/DRU itself (more on that in a subsequent post).
b. The second phase prepares the data for the replay, after which it is stored in a file.
To begin the preprocessing steps, you’ll use the command:
dreplay preprocess –i <Trace Name.trc here> -d <Trace Folder Name here>
which is a very basic preprocessing command. The commands on the example screen below tell the controller where the trace file is and to which path to store the preprocessed files.

For instance, if my trace file was
named DRUDemo_012345.trc and was located on C:DRUTraces, and I wanted the
preprocessed files to be stored on the same drive and file, the command would
be:
dreplay preprocess –i C:DRUTracesDRUDemo_012345.trc -d C:DRUTraces
3. Do the Replay. For the replay itself, you have the following options:

If you need to change any of the parameters for the replay, you should do that now. To change parameters, go to C:Program Files (x86)Microsoft SQL Server110ToolsBinn and locate the DReplay.Exe.Replay.config file (Microsoft recommends making a copy of this file and modifying the copy rather than the original). Next, modify the location of the config file to the new file. The additional available distributed replay configurations can be found here.
Once you have made the necessary modifications and have ensured the proper permissions are in place, you are ready to replay your workload. You can use either server monitoring software or Perfmon to gauge server stress or other metrics. In the example below, I begin with a very basic command, omitting the output file. The replay screen shown below is very short, as it was done for the purpose of demonstration only. If you want the output file (highly recommended), simply add an –o to the end of the command, like so:
dreplay replay –s “<target server name here>” -d “<preprocessed file location>” -w “<client(s) server(s) here>” -o

So, if I have a target server named
DRUTarget1, with my preprocessed file location of E:Traces and a client server
named DRUClient, the command looks like this:
dreplay
replay –s “DRUTarget1” -d “E:Traces” -w “DRUClient” -o
As with preprocessing the trace, the
replay is also done in two phases:
- In the first phase, the events are dispatched;
and
- In the second phase, the data is physically
replayed on the server.
In the next post, I’ll go into some issues experienced with
the DRU during server load testing.
AdditionalReading:
- https://www.sqlskills.com/blogs/jonathan/performing-a-distributed-replay-with-multiple-clients-using-sql-server-2012-distributed-replay/
- https://msdn.microsoft.com/en-us/library/ff878359(v=sql.110)
- https://msdn.microsoft.com/en-us/library/ff878467(v=sql.110)
- https://msdn.microsoft.com/en-us/library/19ff5285-fb9d-4fd1-97c4-ec72c311c384(v=sql.110)
- http://borishristov.com/blog/speaking-for-the-pass-dba-virtual-chapter/#more-4457 (Side note: Boris has been out of the DBA community for over a year and no longer accepts questions on the DRU, but his material is an excellent resource.)
- http://borishristov.com/blog/distributed-replay-faq/
- https://www.youtube.com/watch?v=8h_3OCIUJiA
- https://channel9.msdn.com/posts/SQL11UPD02-REC-10