

(This is the third post in a three-part series on how AI is changing the way we build solutions in Microsoft Fabric. The first post explored how the new unified Copilot in Fabric and Project Osmos help build and transform data, moving from AI assistance toward agentic execution. The second post looked at building reports and analytical applications, comparing Copilot on the Power BI report canvas with Modern Report Builder. This third post will focus on using AI to build semantic models, ontologies, and Fabric Data Agents—the pieces that define what the data means and help people ask useful questions about it.)
As AI takes on more of the work of building analytical solutions, we need to give it a clear understanding of the business. What counts as revenue? How does an order relate to a customer? Which calculation should an agent use when someone asks whether sales are declining?
Semantic models, ontologies, and data agents address different parts of that problem. AI can help authors build and configure each of them, but the quality of the result still depends on the definitions and requirements we provide. The more work we express through natural language, the more important it becomes to make those definitions explicit and reusable.
A Sales Example and How the Pieces Fit Together
Let’s use a hypothetical sales organization throughout this discussion. It has customers, orders, products, returns, and sales regions, and managers want to understand which customers are generating less net revenue. That is a more precise question than asking who is “buying less,” because revenue can decline through discounts, refunds, or changes in product mix even when purchasing volume stays the same.
For this example, assume the business has agreed that net revenue means invoiced sales after discounts, minus refunds, with canceled transactions excluded. Comparisons use completed calendar quarters. Sales count in the quarter of the invoice date, and refunds reduce revenue in the quarter when the refund is posted. That is the policy for our example; another organization might make a different decision.
Our job is to carry that definition consistently into the analytical model and the experiences that use it.
| Component | What it contributes to the example | AI authoring experience |
|---|---|---|
| Power BI semantic model | Reusable calculations such as Net Revenue, supported by tables, relationships, and analytical metadata | Copilot in web modeling and the Semantic Model Authoring skill |
| Fabric ontology | Shared business concepts and mappings across sources, including connections among sales, support, and fulfillment | Ontology Agent |
| Fabric data agent | A conversational way to ask questions and obtain answers from its configured sources | Build agent with AI |
These roles overlap. Semantic models also describe business concepts and relationships, while ontologies can reference established measures. The table shows their emphasis within this example.
The components also do not form a mandatory three-step pipeline. A Fabric data agent can use a Power BI semantic model directly. For our initial revenue question, I would begin with that model and its approved calculations. An ontology becomes more useful when the solution needs shared concepts across several models, sources, or business domains.
Building Semantic Models with AI
A Power BI semantic model organizes data into something people can analyze consistently. It contains tables, relationships, and reusable calculations called measures, such as net revenue or gross margin. Defining a measure centrally gives report authors and other consumers an established calculation to use.
Microsoft’s Copilot in web modeling, currently in preview, helps authors analyze and change models through natural language. In the Power BI service, open a semantic model in Model view, switch to Editing mode, and select Copilot. You can ask it to examine relationships, refine measures, and improve names and descriptions.
For our sales model, an illustrative request would be:
Review Customers, Orders, OrderLines, Products, and Returns for relationships that could double-count sales. Propose a Net Revenue measure using invoiced sales after discounts minus refunds, excluding canceled transactions. Use the invoice date for sales and the posting date for refunds. Explain the relationships and date fields involved, and identify any missing information before making assumptions.
The business definition gives the assistant a target. The questions about relationships and dates help expose mistakes that a plausible-looking formula could otherwise hide.
Before accepting the calculation, I would give it a few small cases with known answers:
| Illustrative test | Expected result |
|---|---|
| A customer has $1,000 in invoiced sales before discounts, $100 in discounts, and $200 in refunds, all in one quarter | Net revenue is $700 |
| A separate $500 order is canceled before invoicing | It contributes $0 to net revenue |
| A customer has $1,000 in net revenue in the previous completed quarter and $0 in the most recent completed quarter | The customer appears in the comparison with a 100% decline |
| A June sale is refunded in July | Under our example policy, the sale contributes to the second quarter and the refund reduces the third quarter |
The customer with no purchases in the later quarter is especially useful. A query that only includes customers with transactions in both quarters could omit exactly the customer the manager most needs to see.
A second authoring route uses an AI coding assistant. Microsoft’s Semantic Model Authoring skill, also in preview, supplies instructions and workflows for creating, editing, deploying, and managing models. It is installed through the Power BI authoring plugin, with associated tools connecting the assistant to model operations.
For example, you might ask GitHub Copilot:
Create a sales semantic model from the curated tables in SalesLakehouse, with customer, product, and date dimensions. Explain the proposed relationships and how the model will represent sales and refunds before applying our approved Net Revenue definition.
The distinction between these routes is primarily the authoring environment. Web modeling provides an integrated Copilot experience in the service. The skill works through a coding assistant and supports both new and existing models. Choose the route that fits how you develop and maintain your solution.
Building Ontologies with AI
An ontology describes business concepts, their properties, and how they relate to one another and to the underlying data. Microsoft’s ontology overview explains how the ontology item in Fabric IQ supplies shared business context for people, applications, and agents.
In the sales example, a Customer places an Order, an Order contains Products, and a Customer belongs to a Sales Region. Those relationships may already be represented adequately in our semantic model. To see why an ontology could add value, expand the question slightly.
Suppose managers also want to identify customers with declining revenue who have unresolved support cases or delayed deliveries. Sales, customer support, and fulfillment may each have their own data sources and their own representation of a customer. We now need to connect those concepts across domains.
The business relationships might look like this:
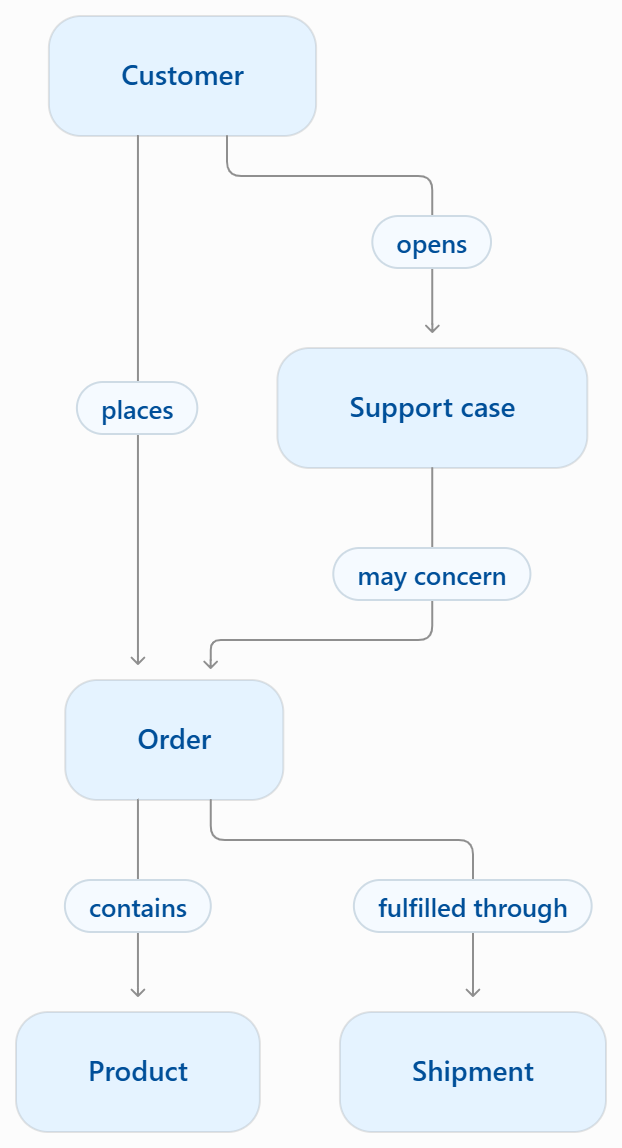
An ontology can provide that shared context while preserving the connection to the systems that own the data. The resulting question might be, “Which customers with declining net revenue also have unresolved support cases or delayed deliveries?” That identifies conditions worth investigating; determining why revenue declined may require further analysis.
The Ontology Agent helps create and maintain this structure through conversation. It can discover relevant workspace data, propose entities and relationships, map them to sources, and validate the definition.
For our scenario, you might ask:
Draft an ontology using the SalesAnalytics semantic model and the customer-support and fulfillment sources in this workspace. Include customers, orders, products, support cases, and shipments. Show each source mapping and identify how customer records can be matched across systems. Flag ambiguous mappings for review.
Start in Plan mode to explore and preview the proposed definition. After reviewing it, switch to Act mode to apply changes. The agent can also query bound data, which helps you evaluate whether the proposed context supports the intended questions.
Another starting point is to generate an ontology from an existing semantic model. This reuses tables, relationships, and measures. You can then use the Ontology Agent to extend the definition with other sources and concepts.
For our Net Revenue calculation, the generated ontology exposes a metric linked to the source measure. The semantic model continues to own the DAX expression, and the ontology adds business context. Microsoft’s metrics documentation also explains that changes to a source measure or its description require refreshing the ontology to reflect the update.
Review the generated keys, relationships, and bindings. A customer identifier in a support system should not be assumed to identify the same customer in the sales system merely because both columns are named CustomerID.
Building Fabric Data Agents with AI
A Fabric data agent gives users a conversational way to ask questions about governed data. Our sales manager might ask:
Which customers had lower net revenue last calendar quarter than the previous quarter, and which product categories contributed most to the decline?
The data agent interprets the question and queries its configured sources. The AI assistant helping an author configure that agent has a separate role. That authoring experience, called Build agent with AI, is what makes data-agent creation relevant to this series.
For the initial sales question, I would connect the data agent directly to the semantic model and have it use the approved Net Revenue measure. That keeps the calculation in the model where we have already defined and tested it.
Configuration depends on the source. Microsoft’s data-source guidance places semantic-model preparation primarily in Prep for AI, including AI instructions and verified answers. The source instructions and example question-and-query pairs used for SQL sources do not apply identically to semantic models.
The following authoring example uses a warehouse source. It is a separate SQL-based approach: its queries must reproduce the approved business definition, and the warehouse connection does not automatically invoke the DAX measure from our semantic model. I would compare its answers against the same known totals used to validate that measure.
Microsoft’s Build agent with AI documentation describes an assistant for refining Agent Instructions, Data Source Instructions, Data Source Descriptions, and Example Queries. You first attach supported sources and select the relevant tables. The assistant can then inspect schemas, examine query history when permitted, propose configuration changes, and run read-only queries. Review the suggestions, accept the appropriate updates, and switch to Test data agent.
For a sales warehouse, an illustrative request would be:
Configure this agent to answer questions about customer revenue declines using our approved net revenue definition. Generate instructions and three example question-and-query pairs covering customer trends, product-category changes, and refunds. Compare completed calendar quarters, using invoice dates for sales and posting dates for refunds. Include customers with no purchases in one quarter, and test for duplicate rows caused by joins.
This gives the assistant a business objective, the relevant policies, and examples of what could go wrong. Its schema inspection and query execution can help turn those requirements into a configuration that an author can examine and test.
Use the earlier validation cases, then try less specific questions such as “Which customers are down?” Check whether the agent uses a documented default or asks for the missing period and metric. Microsoft’s creation walkthrough explains how to inspect generated queries and intermediate steps when an answer needs investigation.
Preserve important instructions before accepting updates: the builder documentation warns that suggestions can replace existing configuration blocks during the preview. A query that executes successfully still needs to produce the intended business answer.
Current Capabilities and Availability
With documentation checked November 9, 2026, Microsoft identifies the capabilities discussed here as follows:
| Capability | Documented status |
|---|---|
| Fabric data agent | Generally available |
| Copilot in web modeling | Preview |
| Semantic Model Authoring skill | Preview |
| Fabric ontology item | Preview |
| Ontology Agent | Preview |
| Build agent with AI | Preview |
The general availability of the core data agent does not mean that every integration or authoring experience is generally available. Check the applicable capacity, tenant settings, permissions, and regional requirements before planning a rollout.
The authoring experiences also use different controls. In web modeling, consent permits changes to the open model throughout the chat session, and Copilot creates a restore checkpoint. Begin with a development model and review the resulting changes with that session-wide permission in mind.
There is also a specific mismatch in the published guidance for Build agent with AI. The setup guide, last updated July 2, 2026, limits the builder to SQL and Eventhouse sources and lists semantic models and ontologies as unsupported in that mode. Microsoft’s September 28 FabCon announcement describes expanded support involving semantic models, documentation, glossaries, and data dictionaries.
The announcement therefore describes broader support than the setup guide. Confirm what is enabled in your tenant before relying on the builder to configure a semantic-model-based agent. A source supported by the answering data agent does not automatically have the same support in its AI authoring assistant.
Conversational Authoring and the Future of the Report Designer
These capabilities raise a broader question: how much longer will we build analytical solutions by writing code or arranging objects in visual designers?
I expect natural language to become the starting point for more of this work. Authors will describe the intended outcome, let AI generate more of the implementation, and then use conversation, visual tools, and code where each provides useful control. There may be many routine tasks where an author never needs to touch the generated code. More complex requirements will still call for inspection, testing, and precise adjustments.
It helps to distinguish two uses of conversation:
- Conversational authoring: “Build a report showing quarterly net revenue by customer and region.”
- Conversational analytics: “Which customers had the largest net revenue decline last quarter?”
The first creates or modifies an analytical artifact. The second helps someone obtain an answer. Both matter, but they change different parts of the workflow.
Are we near the end of the Power BI report designer? I expect its role to evolve as AI handles more of the initial construction. Copilot on the report canvas already works within Power BI Desktop and the service to create and edit report pages. Microsoft’s current limitations still include custom visuals and styling or formatting changes.
My expectation is that authors will spend less time starting from a blank canvas and more time inspecting, correcting, and refining generated reports. The designer provides a place to assess the layout, check interactions, consider accessibility, and make targeted changes before a report reaches its audience. The amount of manual work should change substantially, while the need to judge the result remains.
Conversational analytics may also reduce the need to build a separate report for every follow-up question. If a manager needs a one-time comparison, a conversation may be enough. A recurring management meeting may still benefit from a shared report with agreed measures, filters, and presentation. An operational application may combine those analytics with forms, approvals, and actions.
That is the distinction I explored in GenAI vs Dashboards: Not the Same (And Never Will Be). People will continue to use analytics through reports, dashboards, conversations, and applications. The useful question is which experience fits the task and how consistently it uses the business definitions underneath it.
Final Thoughts
Across this series, AI is taking on more of the work involved in preparing data, building analytical experiences, and configuring the models and context behind them. That creates an opportunity to spend more time defining the intended outcome and checking whether the solution delivers it.
For the sales example, I would begin with a trusted Net Revenue measure, connect a data agent directly to the semantic model for the initial question, and add an ontology when questions across sales, support, and fulfillment justify the additional context. If I choose a warehouse-based agent, I would verify its SQL results against the same approved definition.
Start with a bounded business question and a few examples whose correct answers are known. Let AI help build the model, propose the relationships, and refine the agent. Then judge the result by whether it produces answers people can understand and use consistently.
The hardest part may still be getting Sales and Finance to agree on what revenue means. AI can help implement and test that decision, but somebody still needs to own it.
Resources and Demos
- Semantic models: Microsoft’s web-modeling introduction and animated demonstration shows the browser experience. The Semantic Model Authoring skill examples cover the coding-assistant route.
- Ontologies: The Fabric IQ retail tutorial walks through business concepts, source bindings, and questions that connect operational data with analytical measures.
- Data agents: The Build agent with AI announcement illustrates conversational configuration. Use it alongside the current setup guide and the availability qualifications above.
The post Using AI to Build Semantic Models, Ontologies, and Fabric Data Agents first appeared on James Serra's Blog.