how to write this query?
-
Hi everyone
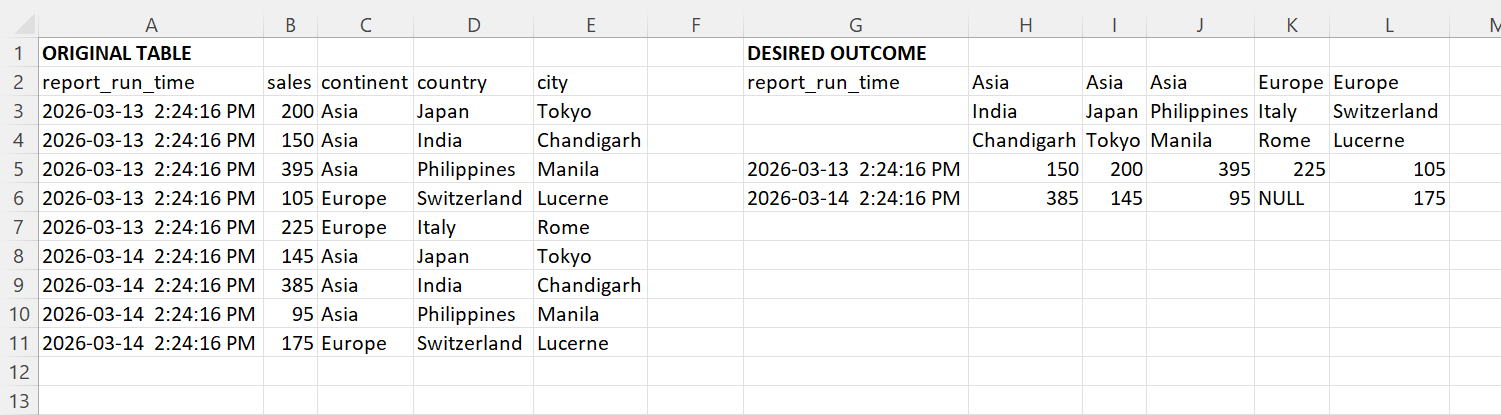
I asked this earlier but the desired outcome is a bit different this time so I am starting a new post. I would like to transform the source table into the desired outcome format. How can I do this?
Desired Outcome:

Sample Data:
drop table if exists #temp1

create table #temp1
(
report_run_time datetime not null,
sales int not null,
continent varchar(50) not null,
country varchar(50) not null,
city varchar(50) not null
)

insert into #temp1
values ('2026-03-13 14:24:16.393','200','Asia','Japan','Tokyo'),
   ('2026-03-13 14:24:16.393','150','Asia', 'India','Chandigarh'),
   ('2026-03-13 14:24:16.393','395','Asia', 'Philippines','Manila'),
   ('2026-03-13 14:24:16.393','105','Europe', 'Switzerland ','Lucerne'),
   ('2026-03-13 14:24:16.393','225','Europe', 'Italy ','Rome'),
   ('2026-03-14 14:24:16.393','145','Asia','Japan','Tokyo'),
   ('2026-03-14 14:24:16.393','385','Asia', 'India','Chandigarh'),
   ('2026-03-14 14:24:16.393','95','Asia', 'Philippines','Manila'),
   ('2026-03-14 14:24:16.393','175','Europe', 'Switzerland ','Lucerne')
Thank you
-
Assuming you want your output columns to be dynamic, based on the input data, this really is best achieved in a reporting tool.
What would your desired output look like if the input data also included (Asia, India, Mumbai)? Presumably also grouped under Asia India? T-SQL queries can't do merged cells.
-
Your sample desired output looks a lot like a PowerPivot in Excel. So I don't think trying to write a query for this is maybe what you want. (or is it?) If you're looking to drill into the data, I'd do it in PowerBI (the UI in Excel isn't my favorite for matrixes.
continent varchar(50) not null,
country varchar(50) not null,
city varchar(50) not null
is essentially a geography/sales territory kind of hierarchy. So what if you put the hierarchy in columns, dates hierarchy on rows, and then totals or whatever on values.
That said, I slapped up a quick matrix in PowerBI...
- Two tables:
- (fact) SalesReporting (city, report run time, sales)
- (dimension) SalesTerritory (city, country, continent)
- ... join them on city. (shocker, right?)
- create a hierarchy of City, Country, Continent, call it (maybe) Geography Hierarchy
- create a measure, Total Sales:= SUM('Sales Reporting'[Sales])
then drop in a matrix
on ROWS: report_run_time
on COLUMNS: Geography Hierarchy
on VALUES: [Total Sales]
done. =)
- Two tables:
Viewing 3 posts - 1 through 3 (of 3 total)
You must be logged in to reply to this topic. Login to reply