TDE- Transparent Data Encryption related question
-
Hi Experts,
Looking for suggestions on TDE encryption.
We have a 3TB database in UAT env. Its in 2-node(node-A, node-B) Alwayson AG.
SQL Server version is SQL 2017 EE CU22.
We turned on TDE encryption node-A. It took more than 12 hours and completed of about 40% encryption.
Meanwhile, unexpected failover occured. we brought it back to preferred node-A.
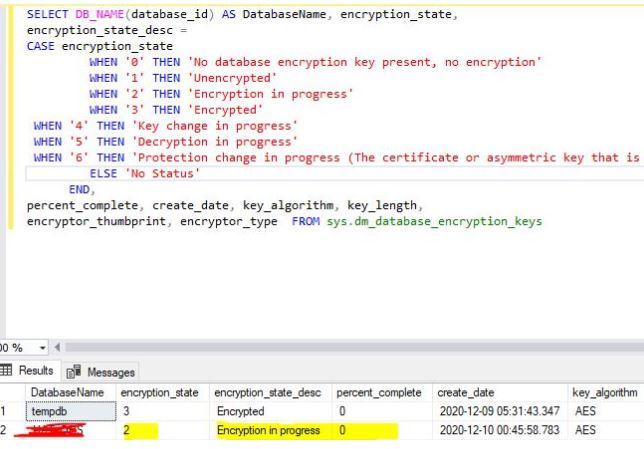
So, we tried to check the progress_complete in the DMV , its again showing 0 percent and it never moved further.
Attaching the screenshot.
Questions
=========
Q) Why it is showing 0 as percent_complete? Did it roll backed due to fail over?

Q) Since it is showing 0 percent_complete, we tried to turn off the TDE in the middle but it throws below error.
Msg 33109, Level 16, State 2, Line 60
Cannot disable database encryption while an encryption, decryption, or key change scan is in progress.
Msg 5069, Level 16, State 1, Line 60
ALTER DATABASE statement failed.
Can't we stop it in the middle just in case if we change my mind as it is taking more time than we actually expected.
Q) For such big databases , is there any guidance/recommendation to follow ? do we need to remove it from AG and then perform TDE and it back to AG?
Please share your valuable thoughts.
Thanks,
Sam
-
What is the result of the query when run on Node B? Is the encryption showing progress in any of the AG replicas? The secondary replica will show 0% until the primary hits 100%and goes back to 0% with encryption_state = 3, meaning encryption is complete.
AG failovers on busy systems (encrypting a large database makes this a busy system) require time after the failover before the new secondary (previous primary) is fully usable.
After starting up the database on the primary replica, there should at some point be an entry in the SQL Server error log "Beginning encryption scan for database <db name>". Look in the log for any encryption-related messages after that, such as a message that reads "Encryption scan for database <db name> aborted. Use ALTER DATABASE to resume". If you see one of those messages, then you have a problem that may be resolved by either
- Ensuring the TDE Certificate used on Node-B is an exact copy of the Certificate on Node-A
- Waiting for the post-AG-failover background cleanup to complete
- And possibly resuming encryption with ALTER DATABASE [...] SET ENCRYPTION ON
If encryption is not running, there should be a reason given in the SQL Error Log.
Eddie Wuerch
MCM: SQL -
We ensured the master key and certificate is made available on secondary replica.
We haven't checked the progress on secondary node. But will monitor this time.
Below are some messages we are seeing inside ERRORLOG on primary node. cluster is failing over due to lease timeout I believe.
2020-12-10 03:11:48.830 spid52 The state of the local availability replica in availability group 'xxxAG02' has changed from 'RESOLVING_NORMAL' to 'PRIMARY_PENDING'. The state changed because the availability group is coming online. For more information, see the SQL Server error l
2020-12-10 03:11:48.830 Server The Service Broker endpoint is in disabled or stopped state.
2020-12-10 03:11:48.830 Server Started listening on virtual network name 'xxxxxLIST02'. No user action is required.
2020-12-10 03:11:48.840 Server The lease worker of availability group 'xxxAG02' is now sleeping the excess lease time (164563 ms) supplied during online. This is an informational message only. No user action is required.
2020-12-10 03:11:48.850 spid21s Database encryption scan for database 'testdb' was aborted. Reissue ALTER DB to resume the scan.
:
:
:
:
2020-12-10 09:39:53.300 spid117 Setting database option ENCRYPTION to ON for database 'testdb'.
2020-12-10 09:39:53.300 spid45s Beginning database encryption scan for database 'testdb'.
2020-12-10 09:45:47.830 spid10s SQL Server has encountered 13 occurrence(s) of I/O requests taking longer than 15 seconds to complete on file [F:\MSSQL\testdb\Data\testdb\testdb_dat.mdf] in database id 38. The OS file handle is 0x00000000000011B4. The offset of the l
2020-12-10 09:45:47.830 spid10s SQL Server has encountered 24 occurrence(s) of I/O requests taking longer than 15 seconds to complete on file [F:\MSSQL\testdb\Data\testdb\testdb_ind.mdf] in database id 38. The OS file handle is 0x0000000000001184. The offset of the l
2020-12-10 09:46:38.310 spid10s SQL Server has encountered 4 occurrence(s) of I/O requests taking longer than 15 seconds to complete on file [F:\MSSQL\testdb\Data\testdb\testdb_prm.mdf] in database id 38. The OS file handle is 0x0000000000000E68. The offset of the la
2020-12-10 09:49:13.960 spid12s FlushCache: cleaned up 291849 bufs with 162799 writes in 706391 ms (avoided 78290 new dirty bufs) for db 38:0
2020-12-10 09:49:13.960 spid12s average writes per second: 230.47 writes/sec
average throughput: 3.23 MB/sec, I/O saturation: 132201, context switches 216738
2020-12-10 09:49:13.960 spid12s last target outstanding: 22240, avgWriteLatency 61857
2020-12-10 09:57:26.750 spid12s FlushCache: cleaned up 146107 bufs with 71409 writes in 432419 ms (avoided 4730 new dirty bufs) for db 38:0
2020-12-10 09:57:26.750 spid12s average writes per second: 165.14 writes/sec
average throughput: 2.64 MB/sec, I/O saturation: 70236, context switches 112082
2020-12-10 09:57:26.750 spid12s last target outstanding: 14, avgWriteLatency 87
2020-12-10 10:06:51.870 spid12s FlushCache: cleaned up 109981 bufs with 52976 writes in 502032 ms (avoided 43393 new dirty bufs) for db 38:0
2020-12-10 10:06:51.870 spid12s average writes per second: 105.52 writes/sec
average throughput: 1.71 MB/sec, I/O saturation: 53587, context switches 91825
2020-12-10 10:06:51.870 spid12s last target outstanding: 22240, avgWriteLatency 156
2020-12-10 10:10:34.970 spid12s FlushCache: cleaned up 64649 bufs with 1421 writes in 155770 ms (avoided 93998 new dirty bufs) for db 13:0
2020-12-10 10:10:34.970 spid12s average writes per second: 9.12 writes/sec
average throughput: 3.24 MB/sec, I/O saturation: 5606, context switches 8230
2020-12-10 10:10:34.970 spid12s last target outstanding: 64, avgWriteLatency 197
2020-12-10 10:15:10.830 spid40s FlushCache: cleaned up 195385 bufs with 3068 writes in 175420 ms (avoided 66958 new dirty bufs) for db 13:0
2020-12-10 10:15:10.830 spid40s average writes per second: 17.49 writes/sec
average throughput: 8.70 MB/sec, I/O saturation: 6993, context switches 12637
2020-12-10 10:15:10.830 spid40s last target outstanding: 228, avgWriteLatency 111
2020-12-10 10:19:28.850 spid10s SQL Server has encountered 1683 occurrence(s) of I/O requests taking longer than 15 seconds to complete on file [F:\MSSQL\testdb\Actifio_1\mssql\Data\testdb\testdb_dat.mdf] in database id 38. The OS file handle is 0x00000000000011B4. The offset of the
2020-12-10 10:19:28.850 spid10s SQL Server has encountered 232 occurrence(s) of I/O requests taking longer than 15 seconds to complete on file [F:\MSSQL\testdb\Actifio_1\mssql\Data\testdb\testdb_ind.mdf] in database id 38. The OS file handle is 0x0000000000001184. The offset of the
2020-12-10 10:19:28.850 spid10s SQL Server has encountered 1 occurrence(s) of I/O requests taking longer than 15 seconds to complete on file [F:\MSSQL\testdb\Actifio_1\mssql\Data\testdb\testdb_prm.mdf] in database id 38. The OS file handle is 0x0000000000000E68. The offset of the la
2020-12-10 10:20:10.030 spid12s FlushCache: cleaned up 104310 bufs with 40267 writes in 549682 ms (avoided 15960 new dirty bufs) for db 38:0
2020-12-10 10:20:10.030 spid12s average writes per second: 73.26 writes/sec
average throughput: 1.48 MB/sec, I/O saturation: 39673, context switches 68483
2020-12-10 10:20:10.030 spid12s last target outstanding: 22240, avgWriteLatency 4173
2020-12-10 10:20:29.350 spid294s FlushCache: cleaned up 51398 bufs with 2710 writes in 250800 ms (avoided 103981 new dirty bufs) for db 13:0
2020-12-10 10:20:29.350 spid294s average writes per second: 10.81 writes/sec
average throughput: 1.60 MB/sec, I/O saturation: 9389, context switches 17206
2020-12-10 10:20:29.350 spid294s last target outstanding: 188, avgWriteLatency 111
2020-12-10 10:23:40.430 spid12s FlushCache: cleaned up 179995 bufs with 3009 writes in 129189 ms (avoided 2033 new dirty bufs) for db 13:0
2020-12-10 10:23:40.430 spid12s average writes per second: 23.29 writes/sec
average throughput: 10.88 MB/sec, I/O saturation: 5615, context switches 13140
2020-12-10 10:23:40.430 spid12s last target outstanding: 28, avgWriteLatency 205
2020-12-10 10:25:56.130 spid294s FlushCache: cleaned up 50825 bufs with 24539 writes in 232311 ms (avoided 42959 new dirty bufs) for db 38:0
2020-12-10 10:25:56.130 spid294s average writes per second: 105.63 writes/sec
average throughput: 1.71 MB/sec, I/O saturation: 27470, context switches 51465
2020-12-10 10:25:56.130 spid294s last target outstanding: 74, avgWriteLatency 85
2020-12-10 10:30:12.370 spid12s FlushCache: cleaned up 154102 bufs with 44645 writes in 196123 ms (avoided 11568 new dirty bufs) for db 38:0
2020-12-10 10:30:12.370 spid12s average writes per second: 227.64 writes/sec
average throughput: 6.13 MB/sec, I/O saturation: 44534, context switches 75311
2020-12-10 10:30:12.370 spid12s last target outstanding: 52, avgWriteLatency 43
Thanks,
Sam
-
The TDE encryption took about 48 hours to complete for a 4.5 TB database.
Post encryption, we are seeing some issues with log backup generation.
We take log backups every 30 hour. Usually, the size used to be around in kb, and max 4GB file.
After TDE implementation, we are seeing log file size as 50GB to 90GB log backup files.
Is that anything to do with TDE? We also have a DR setup from AG Primary to a remote location from East location to West location and now all of a sudden the log shipping restore jobs starts failing due to space issues.
We also use backup compression feature on the instance.
Any thoughts of why the log backups can be so big post TDE implementation ? We are also contacting App team if there is any workload change.
-
Dear Vsamantha35,
Have you tried to compress your backup ??, if so you must specify a MAXTRANSFERSIZE option in your backup greater than 65536.
Just one idea
-
Good Evening,
I've run into this in the past and there is a couple things you can try. First check to make sure there isnt any corruption in the database by running a DBCC check, after that try this on the database
DBCC CHECKDB(<DBName>) WITH NO_INFOMSGS

GO

DBCC TRACEON(5004)

GO

DBCC TRACEOFF(5004)

GO

ALTER DATABASE  <DBName>

SET ENCRYPTION ON
Viewing 6 posts - 1 through 6 (of 6 total)
You must be logged in to reply to this topic. Login to reply