How to do a Matrix properly
-
Hi everyone
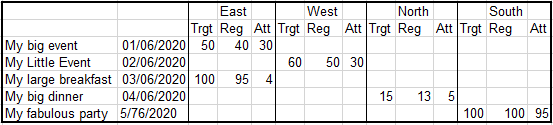
I have some events data with related delegates. The events have two parameters (Category and Region - an event only has one of each of these), I've created datasets and parameters for these lists and they appear to be working fine. I have a row group of Event Name and a column group of Region. For each event I need to return a column Region that has 3 child columns - Target, Registered and Attended as per the example below. The Registered and Attended fields are calculated fields I created in the dataset (e.g. if status = Attended, 1, 0), Target is a field already on the Event record. On the report, Attended and Registered are sum(Fields!Attended.Value) and sum(Fields!Registered.Value).

My problem is that the Registered and Attended are working perfectly - for each event, the data only appears in the Region column the event is assigned. The Target column, which is the field held directly on the event itself, appears on every Target column under each Region for every event. However, if I only add the Target column to the report, the preview returns the correct Target data, with the figure showing under only once per event and in the correct Region column.
It doesn't seem to matter at what point I add the Target column to the report, or what position in the three columns I add it - as soon as there is more than 1 column under Region, it throws a wobbly.
Does anyone out there have a Scooby what's occurring please? NOTE: this is a fetchxml report, not sql.
Please help 🙂
Many thanks
Jules
-
Thanks for posting your issue and hopefully someone will answer soon.
This is an automated bump to increase visibility of your question.
Viewing 2 posts - 1 through 2 (of 2 total)
You must be logged in to reply to this topic. Login to reply